
19th February 2020
Given the media coverage and understandable surprise at the severity of UEFA’s ban imposed on Manchester City, it is perhaps easy to forget or overlook why the club has found itself in the middle of a regulatory storm. Here is an extract from the statement on UEFA’s website:
“Following a hearing held on 22 January 2020 the Adjudicatory Chamber of the UEFA Club Financial Control Body (CFCB), chaired by José da Cunha Rodrigues, has today notified Manchester City Football Club of the final decision on the case which was referred by the CFCB Chief Investigator.
The Adjudicatory Chamber, having considered all the evidence, has found that Manchester City Football Club committed serious breaches of the UEFA Club Licensing and Financial Fair Play Regulations by overstating its sponsorship revenue in its accounts and in the break-even information submitted to UEFA between 2012 and 2016.
The Adjudicatory Chamber has also found that in breach of the regulations the Club failed to cooperate in the investigation of this case by the CFCB.”
Club Financial Control Body Adjudicatory Chamber decision on Manchester City Football Club – issued 14th February 2020
So just to be clear, the ban is for the breach of Financial Fair Play Regulations and the failure to cooperate with the investigation. The second point has largely been absent from much of the recent coverage from what we have seen to date.
No doubt the lawyers on both sides of this spat will be sharpening their quills and their respective arguments as the case heads towards the Court of Arbitration for Sport.
Financial Fair Play was originally conceived as a scheme to reduce and control club debt across Europe under the eventual direction of Michel Platini, who just to cloud the picture even further, was subsequently found guilty of ethics violations during his term of office as UEFA President. Very simply, the scheme works by restricting clubs from spending more than they earn in revenue over a period three years and on a roiling basis. Spending on infrastructure, training facilities and youth training is not considered to be part of a club’s FFP submission.
In current form, it is something of a rather blunt instrument to a potentially complex problem and one wonders whether all of the consequences were sufficiently thought through. For example, FFP does not cope particularly well with some of the more common structures found throughout the corporate world ie Holding Co – Operating Co. The role and status of a holding company and its relationship with its operating subsidiaries including the transfer and recognition of costs from one entity to another is just one point of concern.
More fundamentally, our principal reservation regarding FFP rests on the nature of what is considered a “cost.” For instance, FFP takes a common, in-going but deeply flawed, perspective that equity capital (share capital & reserves) is free. Consequently, the resulting outputs will give a profoundly misleading signal regarding the economic context of both the club and the game. More generally, because FFP as currently drafted will in all likelihood overstate the degree of “value creation”, it has the potential to give an overly optimistic picture of the game’s economics.
Largely this is due a construct using accountancy rules and conventions many of which were conceived just after the Industrial Revolution and the accountancy view is that all equity capital has no cost. In the late 1950s, the Nobel prize-winning economists Modigliani & Miller proved what is obvious to most 12 years olds in that equity capital does indeed have a cost, whether the accountants choose to recognise it or not. Furthermore, they put forward the Capital Asset Pricing Model (CAPM), as a calculation approach – the algebraic representation of risk and return. Indeed, if you refer to our own Economic Profit page, you will find a more detailed explanation of what is involved.
The concise version is that all capital comes with a cost. Add in taxation and the end result is a transparent and comprehensive view of business performance, far beyond any earnings-based measure such as Pre-Tax or the rather ridiculous EBITDA (Earnings Before Interest, Tax, Depreciation or Amortisation).
Some examples
Here are a number of very artificial examples with FFP involving our fictional football club Blog Athletic and its financial performance. These examples are simply constructed to demonstrate a principle and nothing more.
All of our examples will use the same revenue, operating expenses, profit on player disposals and interest rate values.
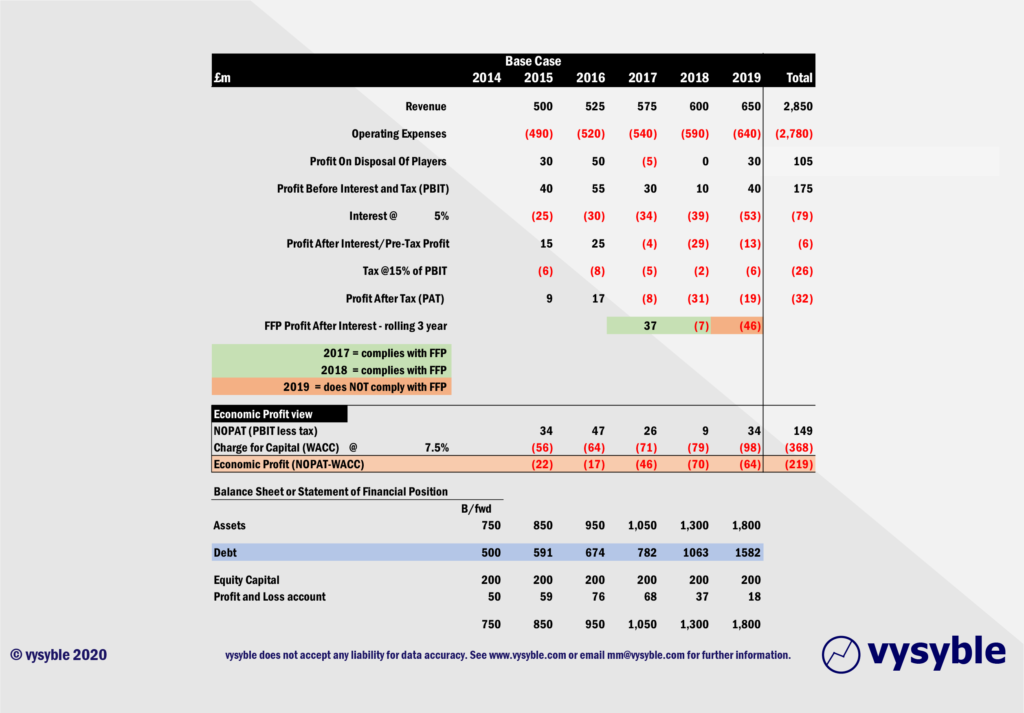
In our first and above example, Blog Athletic has been very successful in generating revenue growth. Therefore, through the “revenue lens” it is a ‘wealthy’ club if you believe the common and widespread myth that revenue in itself is indeed an expression of wealth or corporate success.
However, the debt profile (in blue) has been expanding over time as players and wages become more expensive, new additions to the asset base are made and returns from the profit and loss account are not sufficient to keep pace. The effect of this is that short-term finance used to fund player acquisitions has increased the debt level and thus the size of the club’s interest payments. Consequently, by the end of the five-year period, cumulative pre-tax profit performance eventually moves into loss.
The owner does not have the means or motivation to increase his/her investment and so the equity capital level of £200m is constant.
As FFP works on a 3-year rolling basis with pre-tax profits less allowances for infrastructure and development (which we are not considering in this exercise), the club only drifts into trouble in 2019 following three successive pre-tax losses despite impressive revenue growth.
The economic profit perspective highlights the increasing cost of all the capital over time i.e. debt plus equity capital. Indeed, in this instance the economic profit position has been one of consistent and increasing losses.
The business performance of the club when viewed through the FFP lens reveals that by 2019 there is a problem. However, the economic profit perspective shows that over the entire period, 2015-2019, the club is not covering all of its costs i.e. economic profits are negative in each and every year.
Therefore, the economic profit perspective would have given a much earlier signal regarding potential problems and long before the eventual FFP breach. It is also worth noting that Blog Athletic accumulates economic losses of £219m during the period whereas its cumulative pre-tax loss is just £6m. A clear example of an earnings-based measure giving the wrong signal of business performance.
Our second example puts Blog Athletic in a slightly different financial and economic position.
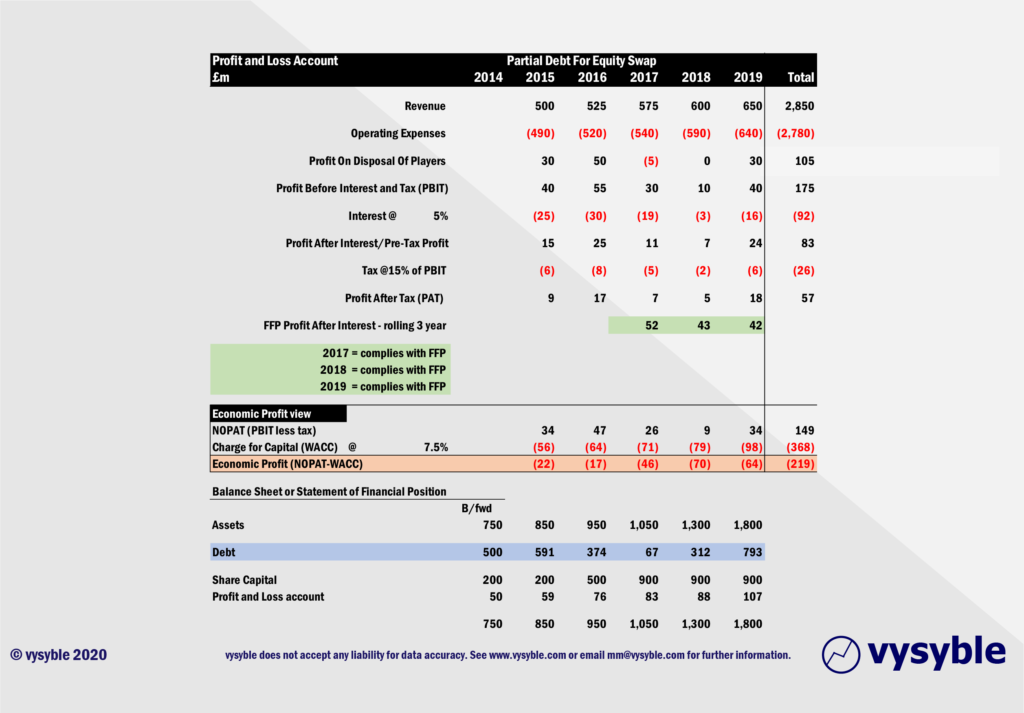
In this example, the operational performance of the club is the same as in the first but the owner has attempted to manage the club’s debt position by swapping some of that debt for additional share capital/equity by making a £300m equity injection at the end of 2016 and a further £400m equity contribution at the end of 2017.
As a result, the club is making steady if uneventful pre-tax profits on a regular basis as it manages to keep interest payments relatively low. Indeed, from an FFP perspective, there is nothing to see.
Despite this, the club is again accumulating economic losses as the owner is forced to inject more equity capital into the business to keep the interest bill manageable. The equity capital value in our example has risen from £200m in 2015 to £900m in 2017. Under the economic profit calculation, this comes at a cost. Once again, the club has accumulated £219m in economic losses over the period as the owner’s capital exposure (cost) has increased.
So, we have ended up with two very different accounting perspectives from essentially the same operational performance. The second example would comply with FFP, but in both cases the economic position remains very challenged.
In our third example, we change things around again from an accounting perspective as the owner of Blog Athletic has decided to eliminate debt (at the end of 2018) and finance the club entirely from equity capital. The operational performance remains the same as the two examples outlined above.
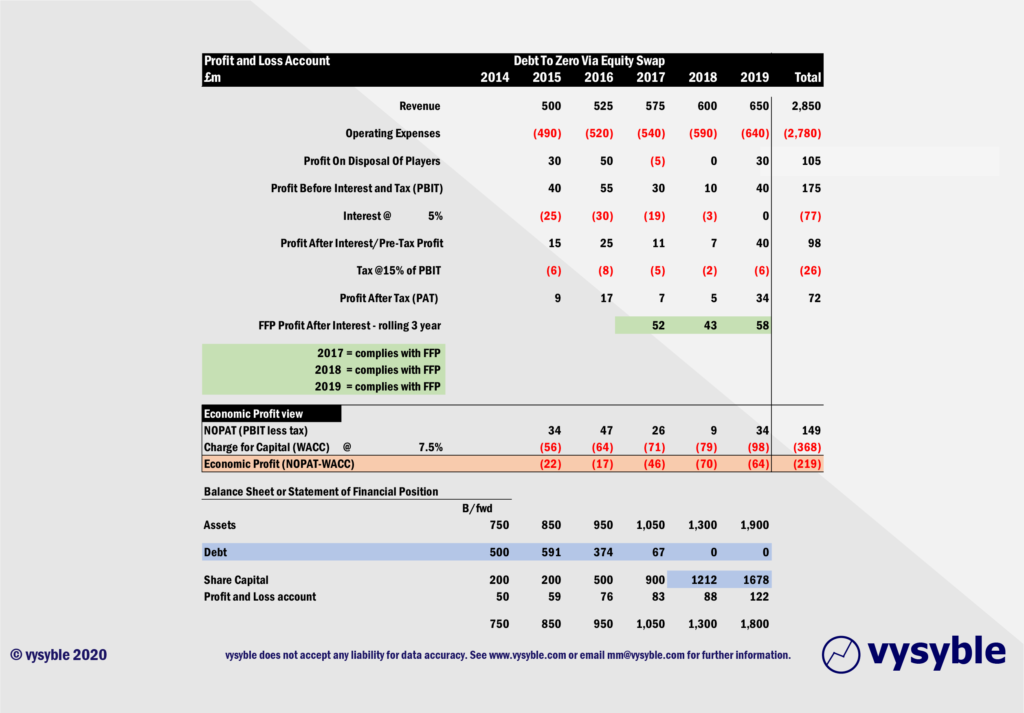
In this example, the owner has been reducing the debt from 2016 onwards with a £312m equity injection in 2018 to bring the debt position back to zero. Consequently, the interest charge in 2019 is zero.
As a result, there are no issues with FFP and the cumulative profit before tax is a seemingly healthy £98m.
However, as we have seen in the previous examples, the economic profit calculation includes a cost for all of the equity capital. As a result, the accumulative Economic Loss under this scenario comes to £219m given the owner’s significant cash injection over the period. Again, this example is telling us that the club is not covering all of the costs of doing business even though the club’s debt has been eliminated.
We are, of course, assuming that the change in capital structure does NOT change our assumed WACC (weighted average cost of capital) of 7.5% – just for the sake of demonstrating the wider principle.
Hopefully, our point about FFP has been illustrated by our artificial examples. There are elements of Manchester City, Chelsea, Manchester United, Aston Villa, Sunderland and numerous others within the three Blog Athletic profiles. FFP and associated schemes cannot and do not adequately address the real financial dynamics in their current form.
The biggest problem with these schemes in our opinion is that the current FFP-type approach is looking in the wrong places to assess and measure business performance. Indeed, we think that some form of financial regulation is not such a bad idea and we have expressed our views on this topic in a previous blog.
As we have demonstrated, our three examples continue to incur significant and increasing cost via continuing losses and/or with additional equity capital injections. The consequences are obvious if the owner is unable or unwilling to continue, yet just one example falls foul of the FFP ruleset despite deepening economic losses in all three cases.
The measure being used is incorrect and does not go deep enough into the balance sheet. Whether we like it or not, equity capital IS a cost item and it needs to be recognised as such. Until it is, football runs the real risk of being caught in a never-ending financial offside trap.
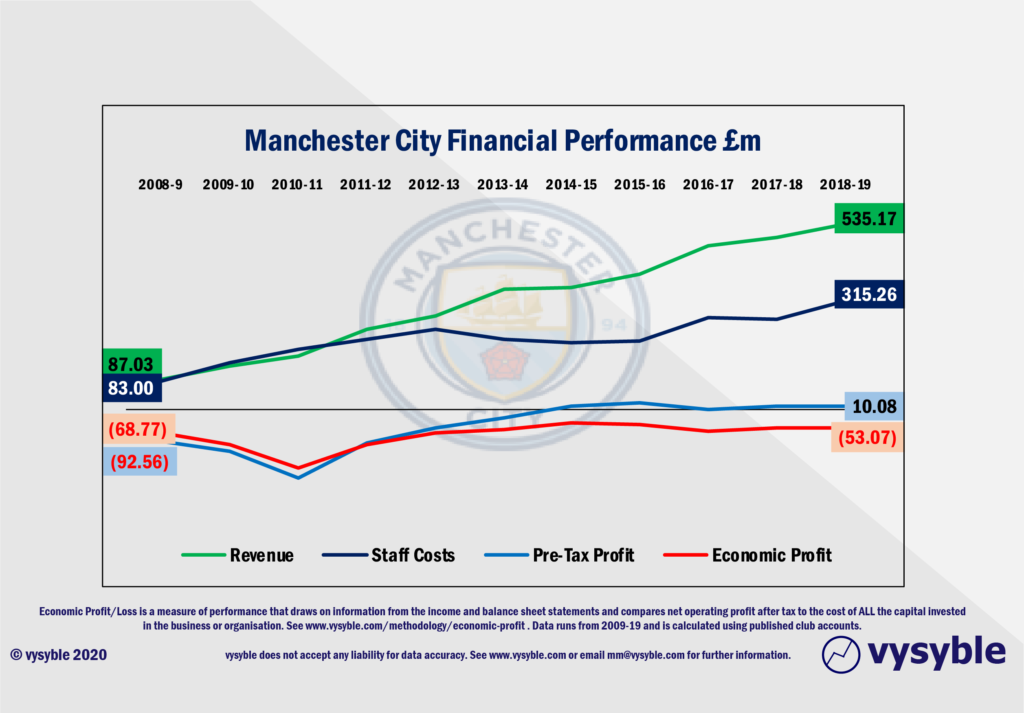
And as for Manchester City, we can at least observe the club’s financial evolution since 2009 both from an economic perspective whereby accumulated economic losses stand at £828m, and an accounting perspective where accumulated revenue stands at £3.47bn and accumulated pre-tax losses stand at £534m….
vysyble
Follow vysyble on twitter