10th October 2019

Time and time again during work with clients, our opinion regarding the financial and economic health of Manchester United is often sought given our well-known coverage of England’s Premier League clubs.
Football is often thought to be cyclical with clubs phasing through periods of success and relative failure. It happens to most of them including the biggest. Indeed, Manchester United endured torrid times following its first European Cup success in 1968. An ageing team, misguided transfers, a faltering youth set-up, insipid leadership at board level and three managerial changes all combined to deliver an eventual relegation from the old first division in 1973.
Yet crowds remained high, the money continued to flow in and a relatively ‘normal’ service was resumed with an instant promotion back to the top division the following year.
Whilst the above description may have the feel of familiarity given recent events, most of the media commentary aside from the inevitable inquests regarding form focus on the business side of the club which is largely influenced by the scale of the revenue number. Thus, the resulting assumption is that the club, relative to its peers, is a financial juggernaut and when viewed through that lens it undoubtedly is. The club generated £4.72bn in revenue between 2009-19 whereas Arsenal, the club ranking 2nd in the Premier League revenue table since 2009 would have to earn a total of £1.5bn in revenue in 2018-19 alone just to catch up.
Certainly, Manchester United’s income from commercial activities is impressive and may go some way to protecting it from the uncertainties related to future broadcasting deals although it can also be argued that the interdependency between commercial and broadcasting activities may prove problematic in the future given the male first team’s poor form on the pitch and a consequential shrinkage in media exposure off it (see later). Missing out on Champions League football can be expensive.
However we caution, as we have done previously, against judging the health of any organisation on the basis of revenue alone. The demise of Thomas Cook with revenues of £9.6bn in the year to 30 September 2018 serves as a timely reminder that revenue is not the be all and end all as an indicator of financial wellbeing.
It is for this reason that our preferred metric regarding business performance is economic profit – a metric that includes all of the costs of doing business and which avoids many of the problems with the deeply flawed accounting metrics such as Earnings Per Share (EPS) and Earnings Before Interest, Tax, Depreciation and Amortisation (EBITDA).
So in order to assess the club’s financial wellbeing, we have to ask four simple questions:
- How has the club performed as an investment on the capital markets?
- What has been the recent economic performance of the club?
- What has been the economic movement between 2013 and 2019?
- What is the economic movement between 2018 and 2019?
How has the club performed as an investment on the capital markets?
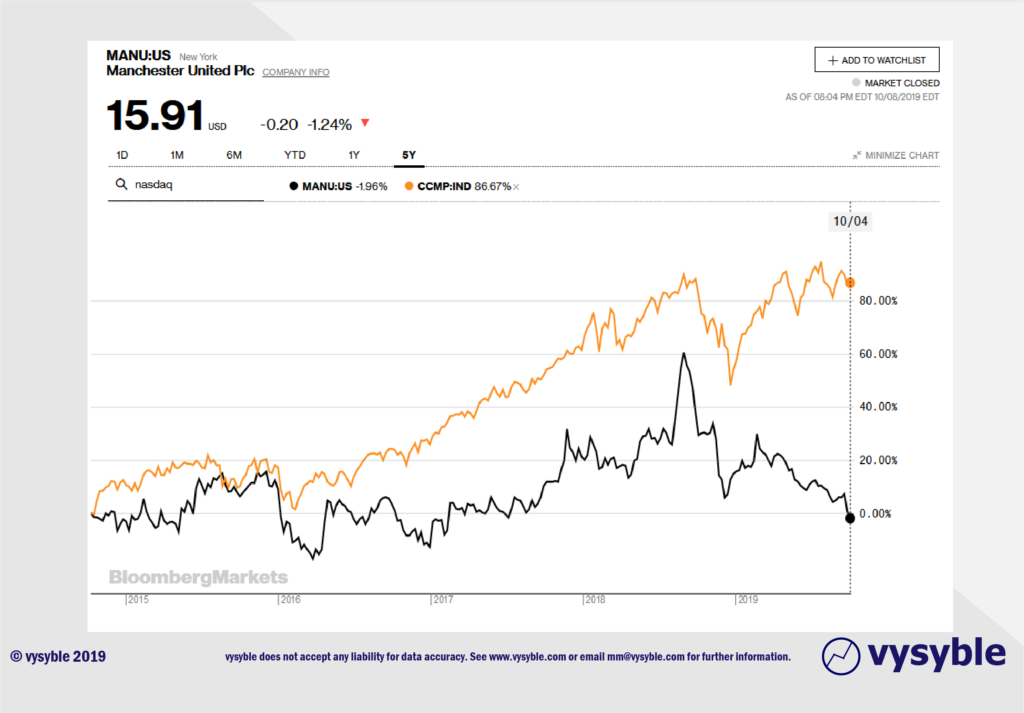
Although the NASDAQ has seen strong growth (86.67%) during the period illustrated, Manchester United’s share price performance has barely moved overall. Perhaps it is a ‘pass’ for the pension plan given the static share performance. Notably, the share price has been in decline since the mid-2018 following heightened (and brief) speculation that Saudi Arabian interests were seeking to purchase the club.
What has been the recent economic performance of the club?
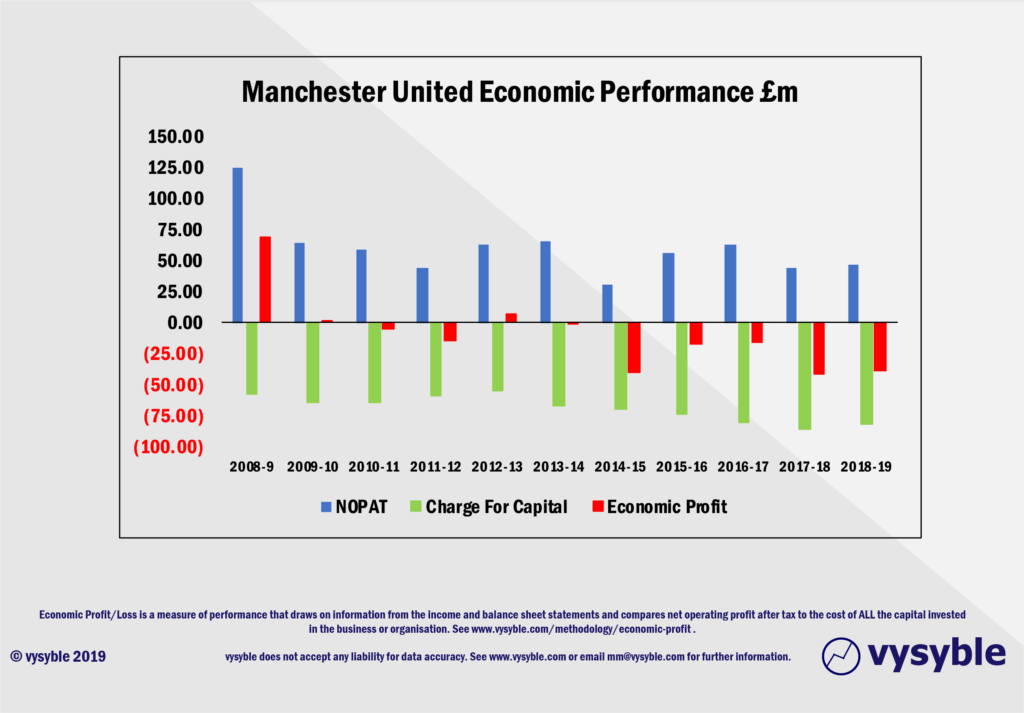
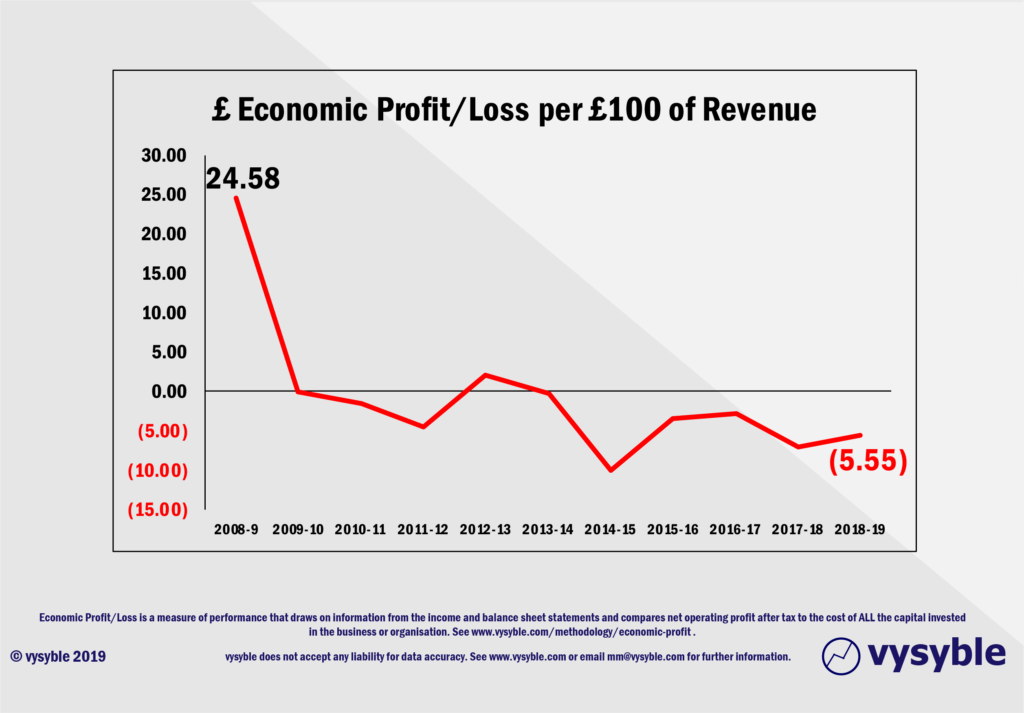
In terms of economic performance, the club has declined particularly following Sir Alex Ferguson’s retirement in 2013 when it last achieved an economic profit. The trend from 2009 is illustrated below.
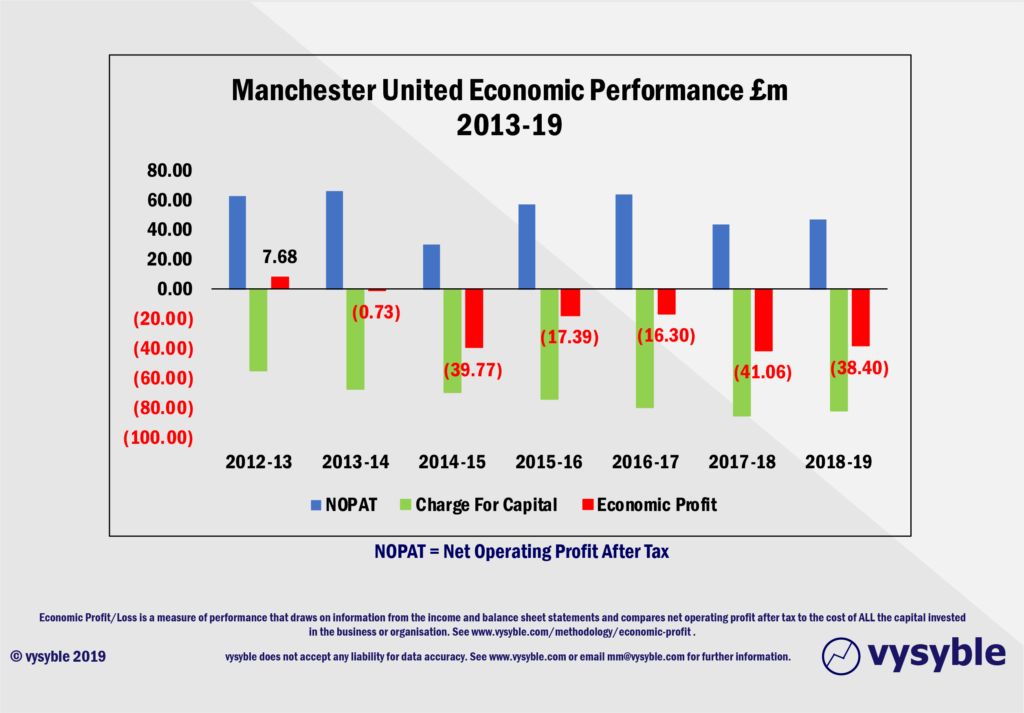
In condensing the view down to 2013-19, the decline in economic performance becomes more apparent.
What has been the economic movement between 2013 and 2019?
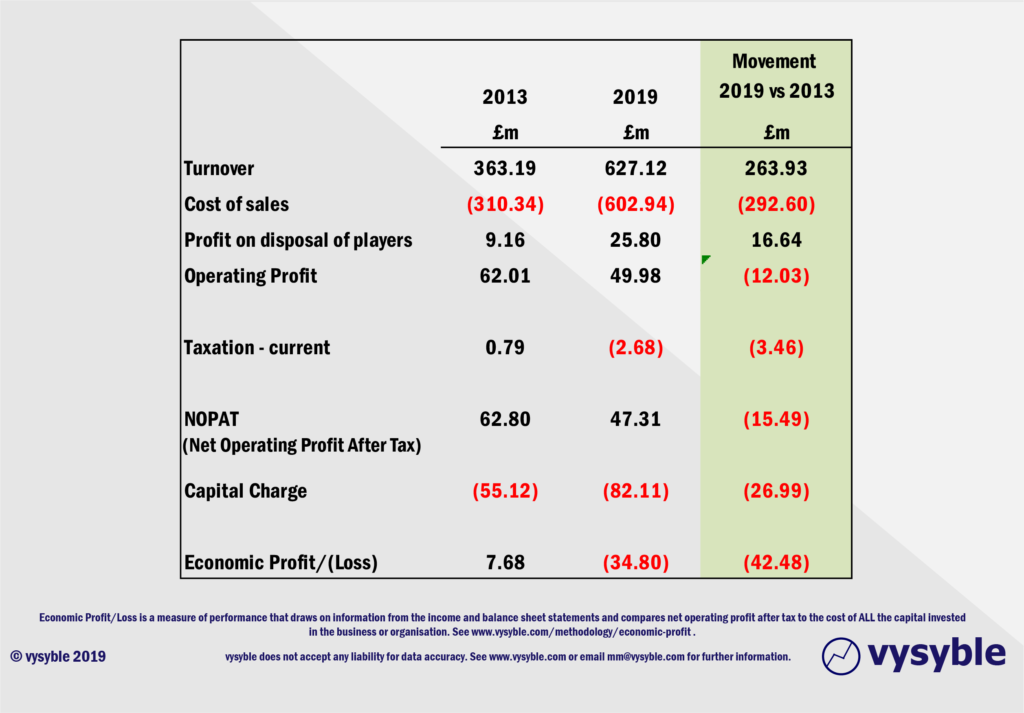
The 2013 NOPAT was £62.80m. It has declined to £47.31m (-24.5%) in 2019 despite revenues rising 72% from £363.19m in 2013 to £627.12m in 2019. Overall economic profit in 2013 stood at £7.68m falling to an economic loss of £38.40m in 2019 which reflects the significant increases in the club’s cost base and the rising charge for capital used in business operations.
Notably, the cost of sales has increased by almost £30m more than revenue over the period and is only partially offset by the profit on player disposals which has resulted in a negative movement of -£12.03m in operating profit.
The economic profit movement is negative to the tune of -£42.48m as a result of declining NOPAT performance and higher capital charges as the business increasingly utilises such capital in its day-to-day operations.
What is the economic movement between 2018 and 2019?
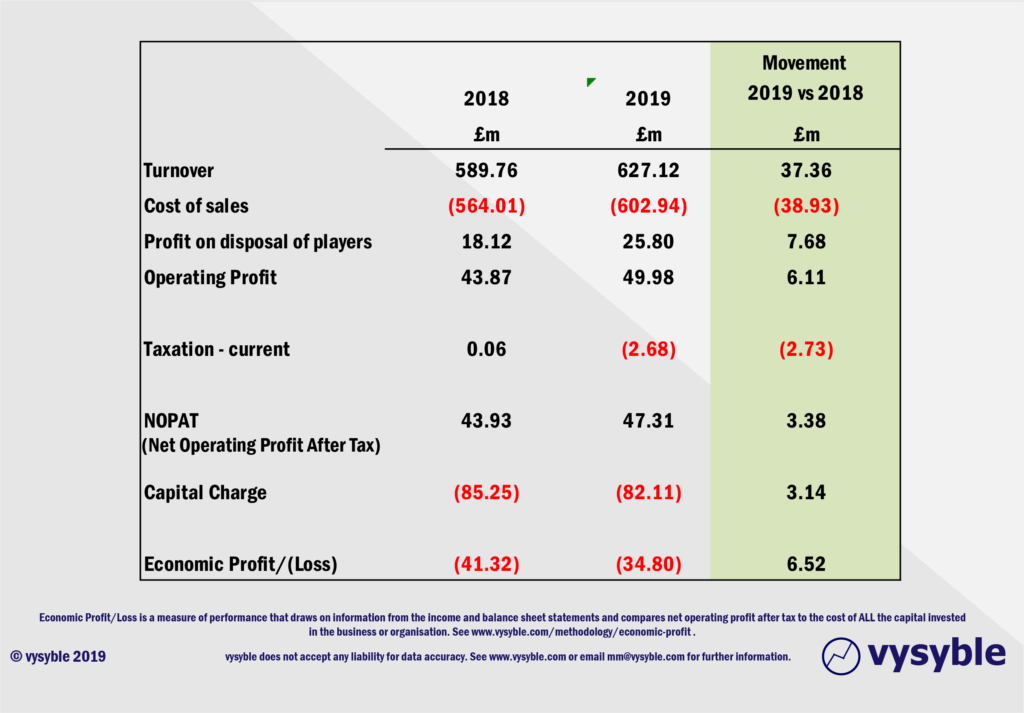
Year-on-year, the club has actually improved its position but is still achieving economic losses despite rising revenues. Again, costs are rising faster than revenue and the improvement is principally due to a higher and potentially “one-off” profit on disposal of players balance.
An ‘interim’ conclusion based on our four questions might state the following:
- Revenue continues to grow at an impressive rate
- NOPAT between 2009-19 is £663.67m
- Based on NOPAT and revenue performance, the financial position of Manchester United looks very healthy.
However, our view is somewhat tempered by the overall economic performance of the club and some of the wider factors which can influence the financial position.
Consider the following….
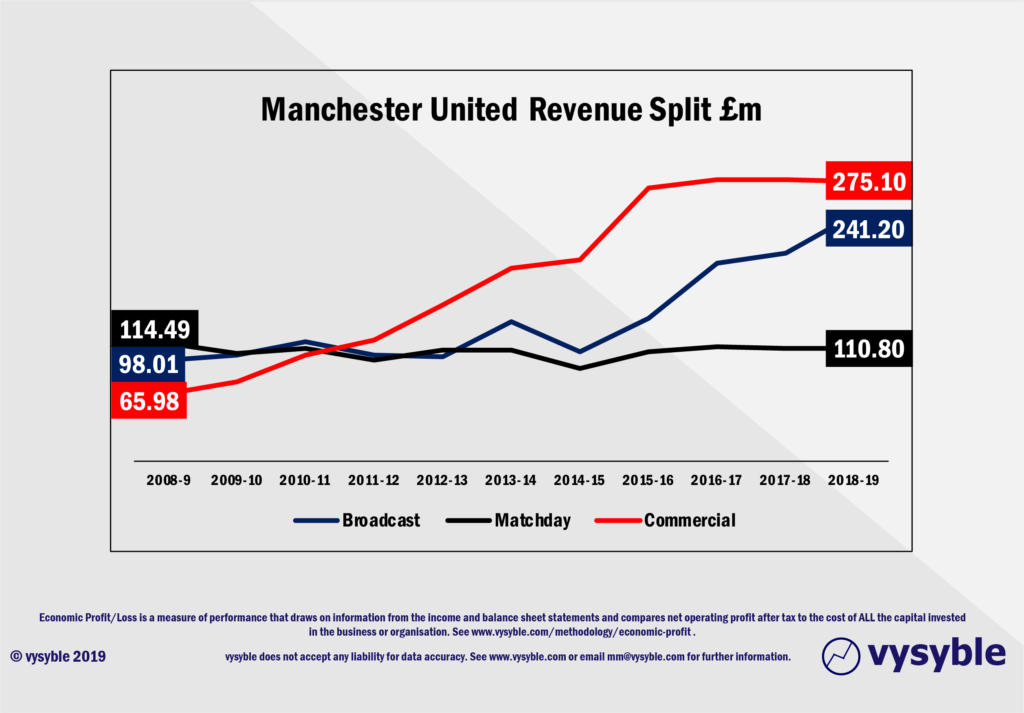
Ed Woodward’s commercial revolution at Old Trafford has served the club well but as the above graphic clearly illustrates, commercial growth has stalled since 2015. Despite his proclamations regarding on-pitch performance and its lack of influence in attaining greater commercial revenues, the data strongly suggests the opposite.
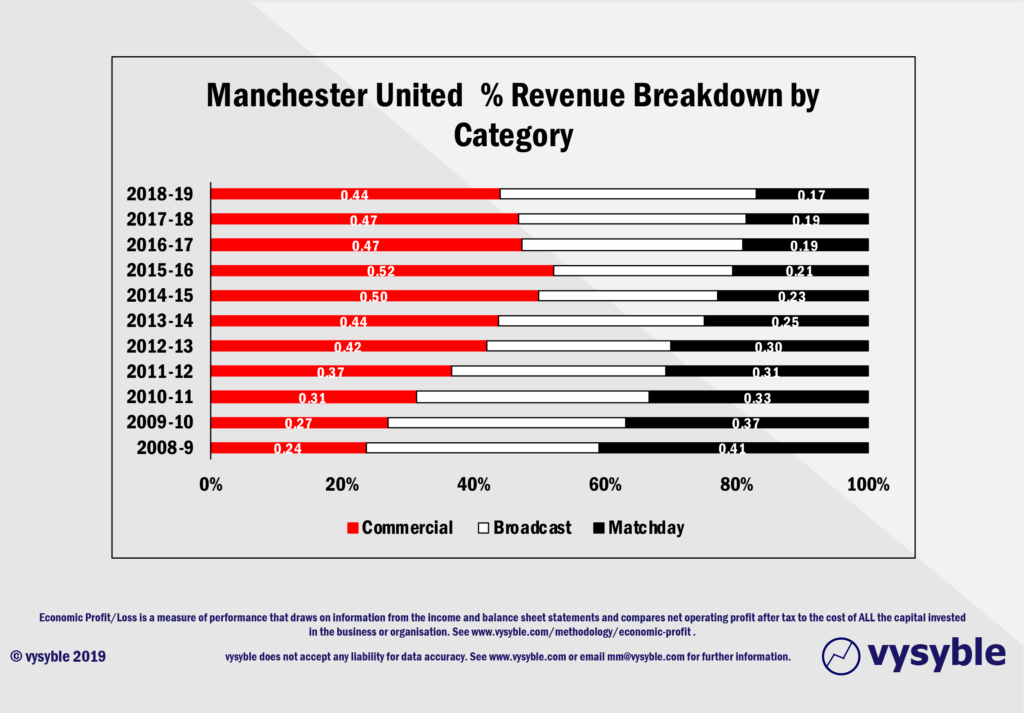
Manchester United’s increasing reliance on TV money is perhaps surprising in that it highlights the importance of Champions League participation. With both Liverpool and Tottenham Hotspur likely to earn a combined £190m-plus from last season’s campaign, the potential lack of opportunity in this area in future seasons could be financially painful with increasing pressure on those flat-lining commercial contracts as the other clubs participating in Europe’s premier cup competition hoover up those increasingly lucrative deals.
The matchday revenue take is static and is generally overlooked as part of the overall financial story. However, with Liverpool and Tottenham Hotspur significantly increasing matchday revenues, Manchester United’s profile by comparison is somewhat concerning.
With the largest stadium in the Premier League at almost 75,000 seats which is full to capacity during most home league games, some may ask ‘what is the problem?’
For starters, the potential lack of top-flight European competition reduces matchday income given that there are less games. Even Europa League participation does not fill Old Trafford on a wet Thursday night.
Secondly, there is a perception that the club owners do not see investment in the stadium as a priority whilst competitive clubs are expanding and improving their own grounds. Tottenham Hotspur’s temporary accommodation at Wembley increased matchday revenue by £25.41m in 2017-18 to £70.95m. We can expect an even higher matchday revenue take as a result of the new stadium in 2018-19.
In this regard, Manchester United could be accused of complacency as it begins to fall behind certain clubs in terms of facilities. The standard between the new Tottenham Hotspur stadium and Old Trafford is vast. Unlike London’s West End theatres, the Theatre of Dreams does not charge a restoration levy. Perhaps it should.
The obvious position for the club is that the team requires continual investment over and above the stadium. This has some merit until on-pitch performance and its costs are examined in detail. And this is where it gets really interesting.
Since 2009, Manchester United has had the highest staff costs in the Premier League on just three occasions – 2013-14, 2015-16 and 2017-18. All post-Ferguson seasons/years. With a 12.29% year-on-year increase to a total of £332.3m for 2018-19, it is more than likely that the club will lead this particular ranking once again. (Some may argue that a proportion of Manchester City’s staff costs are sitting within the accounts of the City Football Group but we have to run with the official published accounts.)
Nevertheless, £332.3m in staff costs achieved a 6th place finish in the Premier League. Not a good return given the high cost of labour. What is of more concern is that the club broke through what appears to be its own limit in terms of wage control ie 50% of revenue. See below:
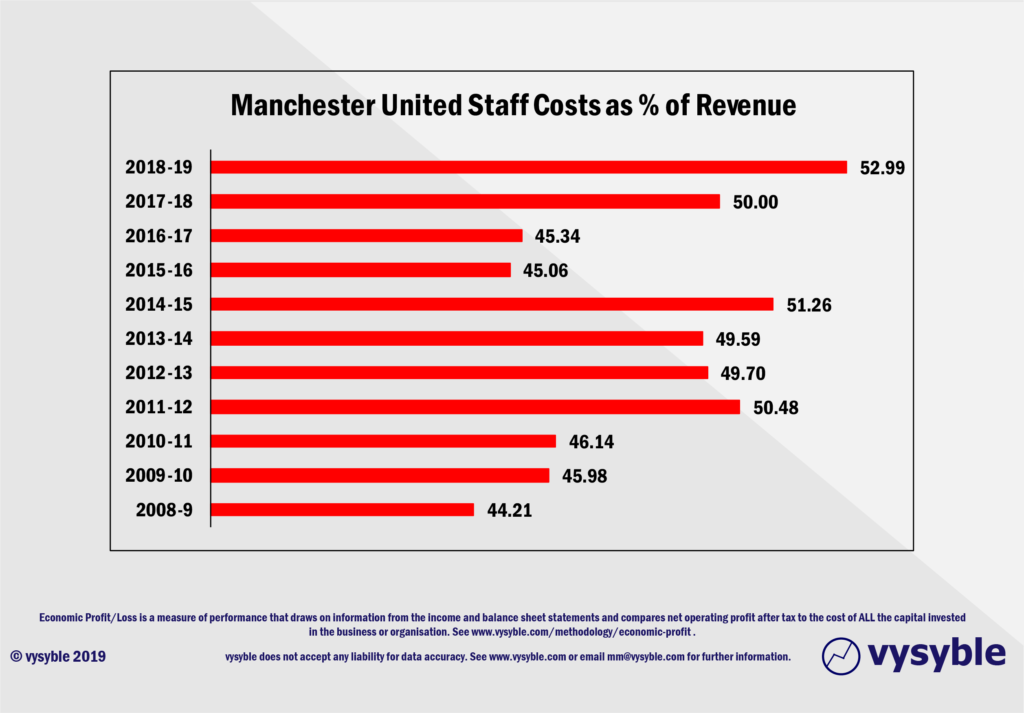
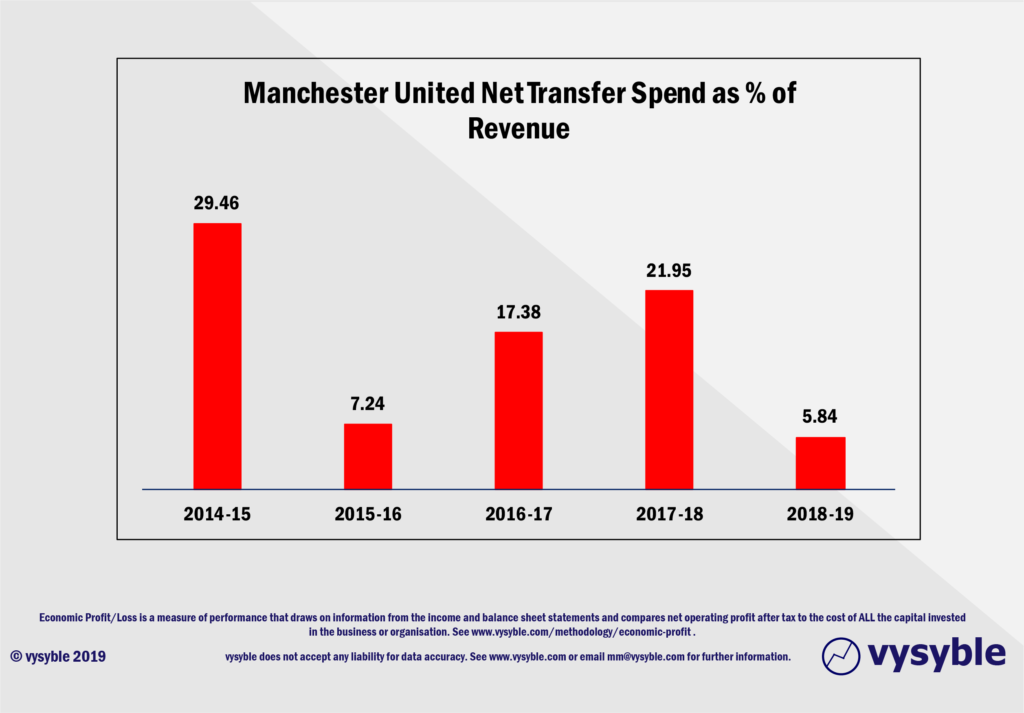
And this was in a year when the club’s net transfer spend was just 5.84% of revenue at £36.6m. This is one of the lowest net spending years for transfers given recent activity yet with the highest staff cost total ever, the club still achieved a not-insignificant economic loss of -£38.4m. Maybe Alexis Sanchez had more impact off the pitch than we are led to believe.
Of course, the accountants will amortise (spread the cost) of transfer fees and other items over a period of years but the economic profit data shows that costs are rising faster than revenue and that the club’s capital charge is not getting any smaller.
On 2018-19 numbers, the club is achieving an economic loss of £5.55 for every £100 of revenue. However, the declining long-term trend is of more concern. The virtuous circle of winning trophies and feeding the financials which in turn fuels the desire to improve the team against heightening levels of competition in order to win more trophies is, in our opinion, in danger of fragmenting at Old Trafford.
As we have seen in other markets, revenue alone is not a saviour. Ed Woodward’s focus on the commercial aspect is fine as long as the tangible end-product is delivering for those commercial investors and partners. However, the ‘herd’ can and does change sentiment and when considered against the club’s flat commercial performance, the continuing and poor on-pitch performance can only impede the club’s ability to maintain its commercial superiority.
The concluding statement and the answers to our four questions may therefore also include the following:
The charge for capital deployed by the club during 2009-19 comes to £757.26m.
Since 2009 revenue has risen from £278.48m to £627.12m, an increase of £348.64m (125%)
“Cost of sales” which includes the staff costs of the players and fees to agents has risen from £235.13m in 2009 to £602.94m in 2019, an increase of 156%
There is a clear risk to future revenue with faltering team performances and possible non-participation in European competitions notwithstanding increasing vulnerability to declining UK media values.
And finally,
Manchester United is enduring a period of significant underperformance when compared to previous years which in turn is challenging the capabilities of the executive management team.
The current strategy appears to be one of increased spending (especially wages) in order to try to attract the best talent. However, this approach does not appear to be working when measured against Premier League position and European competitive performance.
There are also increasing risks to the business given improving commercial acumen within the club’s peer group and its own apparent inability to increase commercial revenues in recent years. The club’s economic profit performance highlights the financial pressures therein with costs rising faster than revenue.
Trying times indeed.
vysyble
