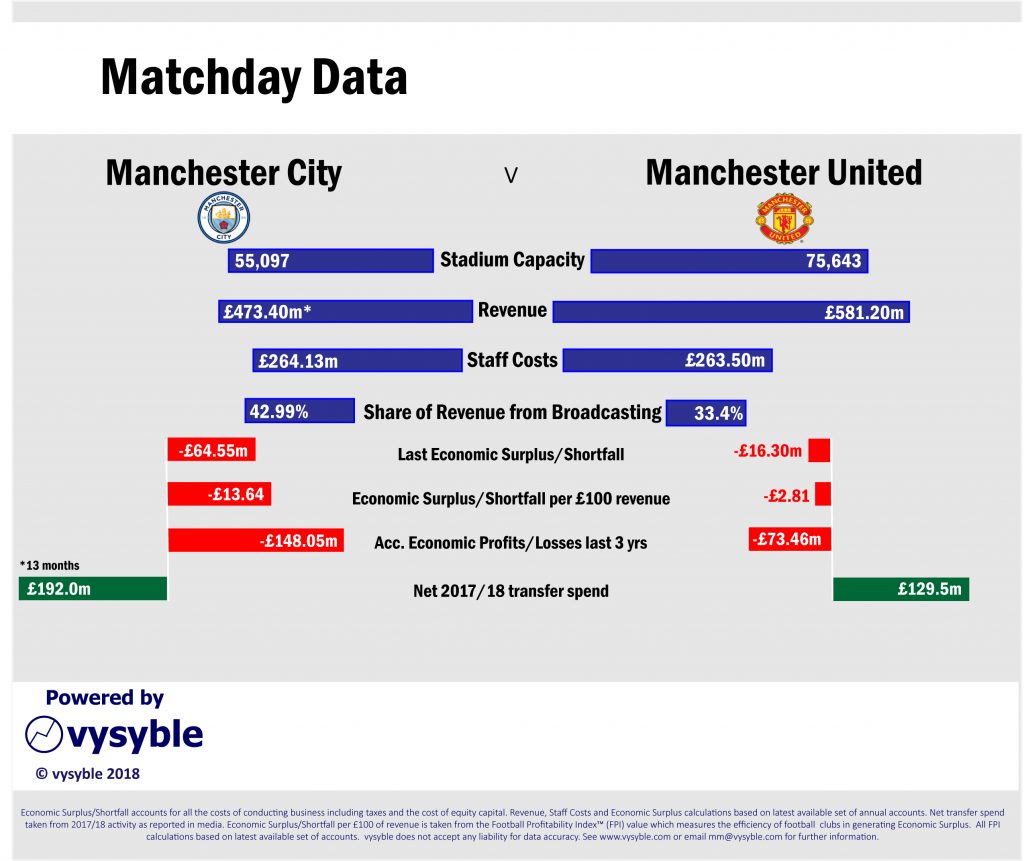
As part of the matchday experience, we have developed an easy-to-use information format that offers football fans a quick and summarised view of their club’s economic position and that of its opponent on the day.
Following successful trials as Matchday Metrics in the early part of the 2017-18 season, the service, now re-named Matchday Data, is the go-to source for economic and financial information on a fixture-by-fixture basis.
Using a combination of data taken directly from the individual clubs’ balance sheets and our own calculations to work out economic performance and the vysyble Football Profitability Index®, we provide a financial and economic snapshot of the fixture in question.
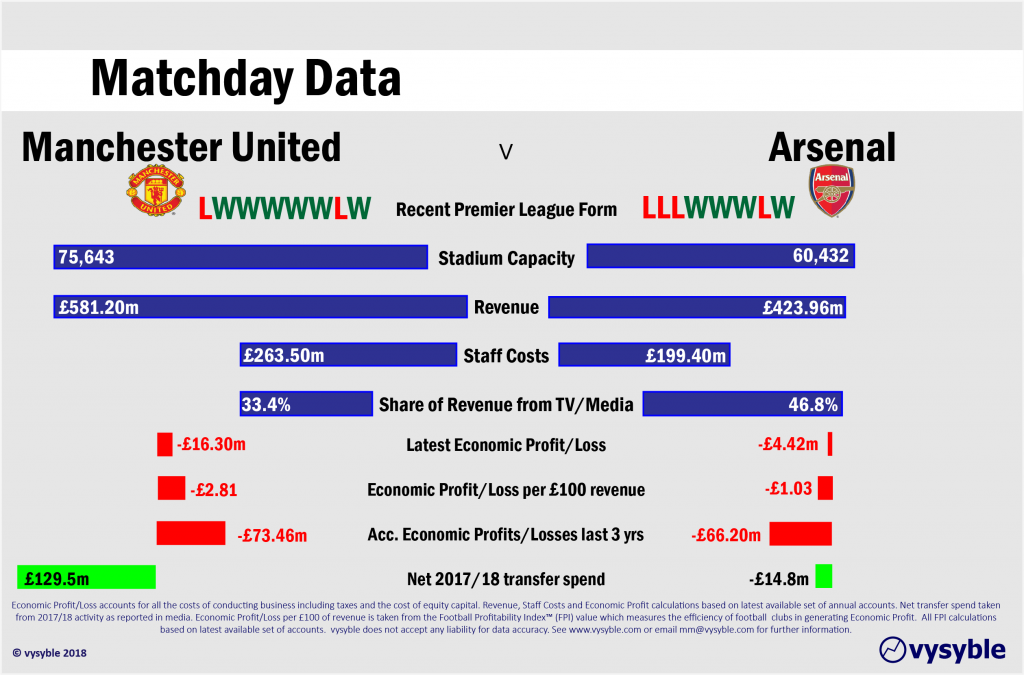
We cover selected Premier League games plus significant fixtures in other divisions and competitions. We also highlight games due to a notable economic or financial aspect eg the Premier League’s first ‘Billion Pound Game’ in December 2017 whereby the combined revenues of Manchester United and Arsenal exceeded £1bn:
Occasionally, we will go into greater detail with a Matchday Data summary of a particular game eg Manchester United vs Arsenal on 5th December 2018.
Matchday Data is available via social media including Twitter (@vysyble, @matchdaydata and also under the following thread: #MatchdayData) and other channels.
The official press release for the launch of Matchday Metrics in 2017 can be found here


