This time last year, the Premier League reached another milestone when Manchester United played Arsenal at the Emirates. It was the Premier League’s first instance of the combined declared annual revenues from both clubs exceeding £1bn in a single fixture. The magic number was £1.005bn although it was to be surpassed in United’s derby game with Manchester City (£1.054bn) just 8 days later.
United v Arsenal harks back to the duelling 90’s and early 00’s when the North Londoners were in their pomp and winning titles against one of the best-ever United first-team squads in living memory. The Invincibles of 2003-4 were one of only two unbeaten senior English teams (the other being Preston North End in 1888-89) in a whole season. Since then, the international appeal of the Premier League has expanded beyond expectation with just 6 clubs within the current crop now under UK-ownership. Both United and Arsenal are under US control.
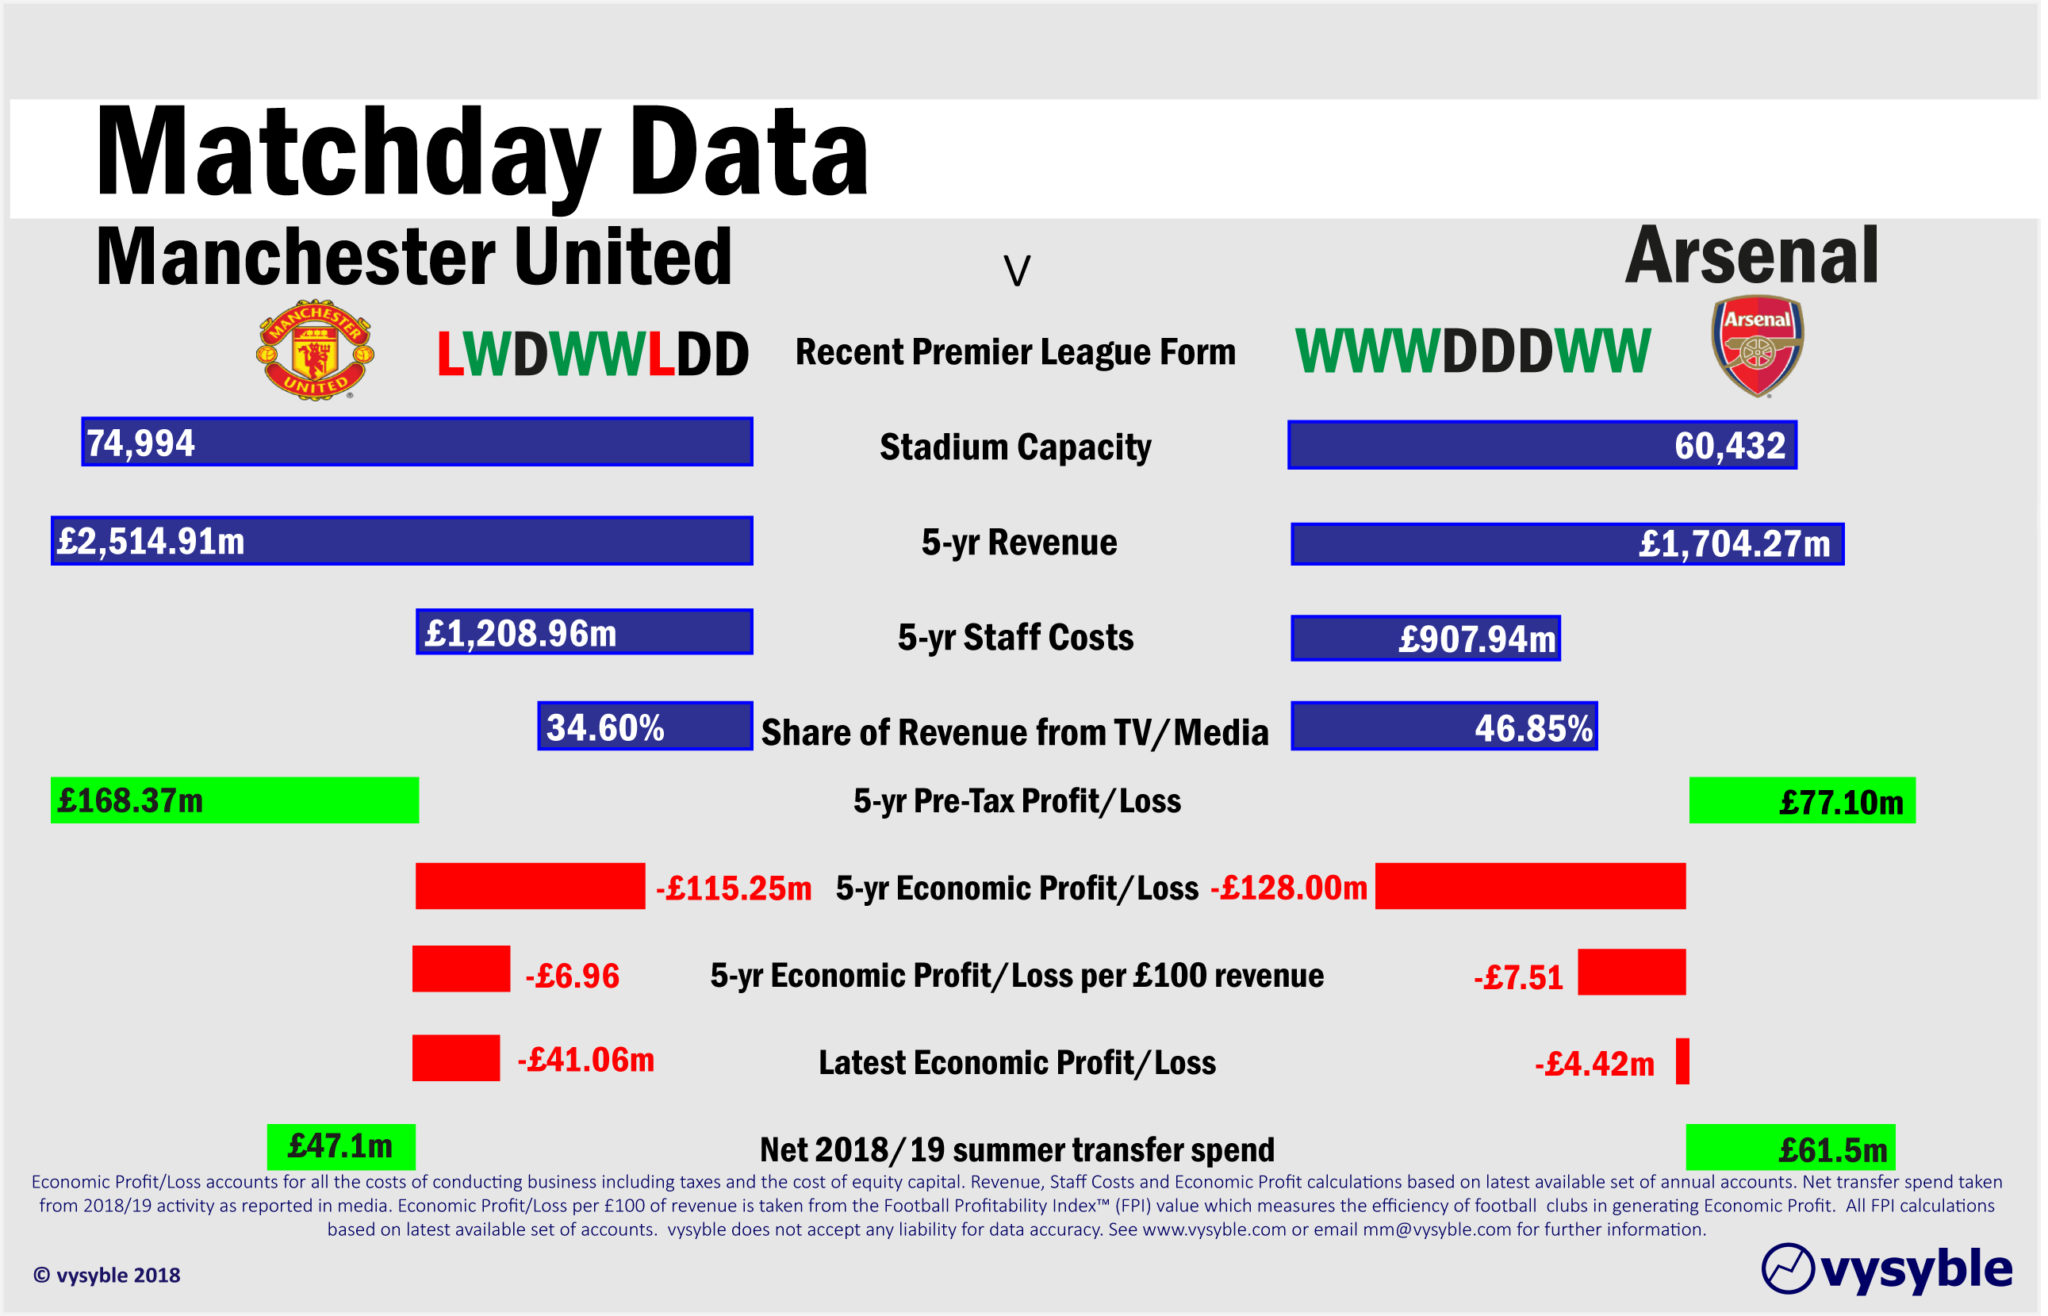
Our Matchday Data panel illustrates performance across various financial measures over a 5-year period which runs from 2014-18 for United and 2013-17 for Arsenal (the club has yet to release 2018 accounts).
The club once known as ‘The Bank of England’ has struggled to keep up with the relentless commercial machine residing within the walls of Old Trafford. 2012-13 was the last time that Arsenal occupied the position as the second-highest revenue earning club in the land behind United which, in turn, has occupied top spot since 2010-11. The club that surpassed Arsenal and now occupies second place is, of course, United’s near-neighbours Manchester City.
We expect Arsenal to deliver a revenue total of around £440m – against United’s £590m – for 2017-18, which would close the 5-year revenue gap to approx. £651m. Nevertheless, United’s financial advantage just from a revenue perspective is all too clear although in recent years this advantage has not made it into the final reckoning at the end of the season.
The staff cost/revenue ratio is often cited as a measure of cost control. United’s record over the last 10 years has been a model of consistency with the ratio sitting safely and firmly between 44-51%. At the 5-year level, United’s ratio is 48% whereas Arsenal’s 5-year ratio is a slightly more restrictive 53%.
Historically, the 2014-15 season staff costs for both clubs were within £10m of each other – United at £202.56m and Arsenal at £192.26m. However, Arsenal’s staff costs rose by just £7.2m to the end of the 2016-17 season, an increase of just 3.7%. United’s, by comparison, increased over 8 times that of Arsenal by £60.94m ie 30.1%.
The differential reflects United’s ambition in attempting to improve matters on the pitch. Indeed, the club had finished below Arsenal in the Premier League between 2014-15 and 2016-17. Conversely, the very modest rise in Arsenal’s staff costs during this time provides some insight into the club’s comparatively restrictive financial regime. Despite this, Arsenal’s performance from 2014-15 was a very creditable 3rd, 2nd and 5th whilst United achieved 4th, 5th and 6th place finishes. Only in 2017-18 did United top Arsenal’s performance with 2nd place versus a Europa League entry-making 6th for the Gunners.
Arsenal’s Achilles heel is the make-up of its revenue in terms of the percentages derived from Broadcast, Matchday and Commercial sources. United have become the standard for the rest of the Premier League when it comes to monetising a football brand as the charts below illustrate:
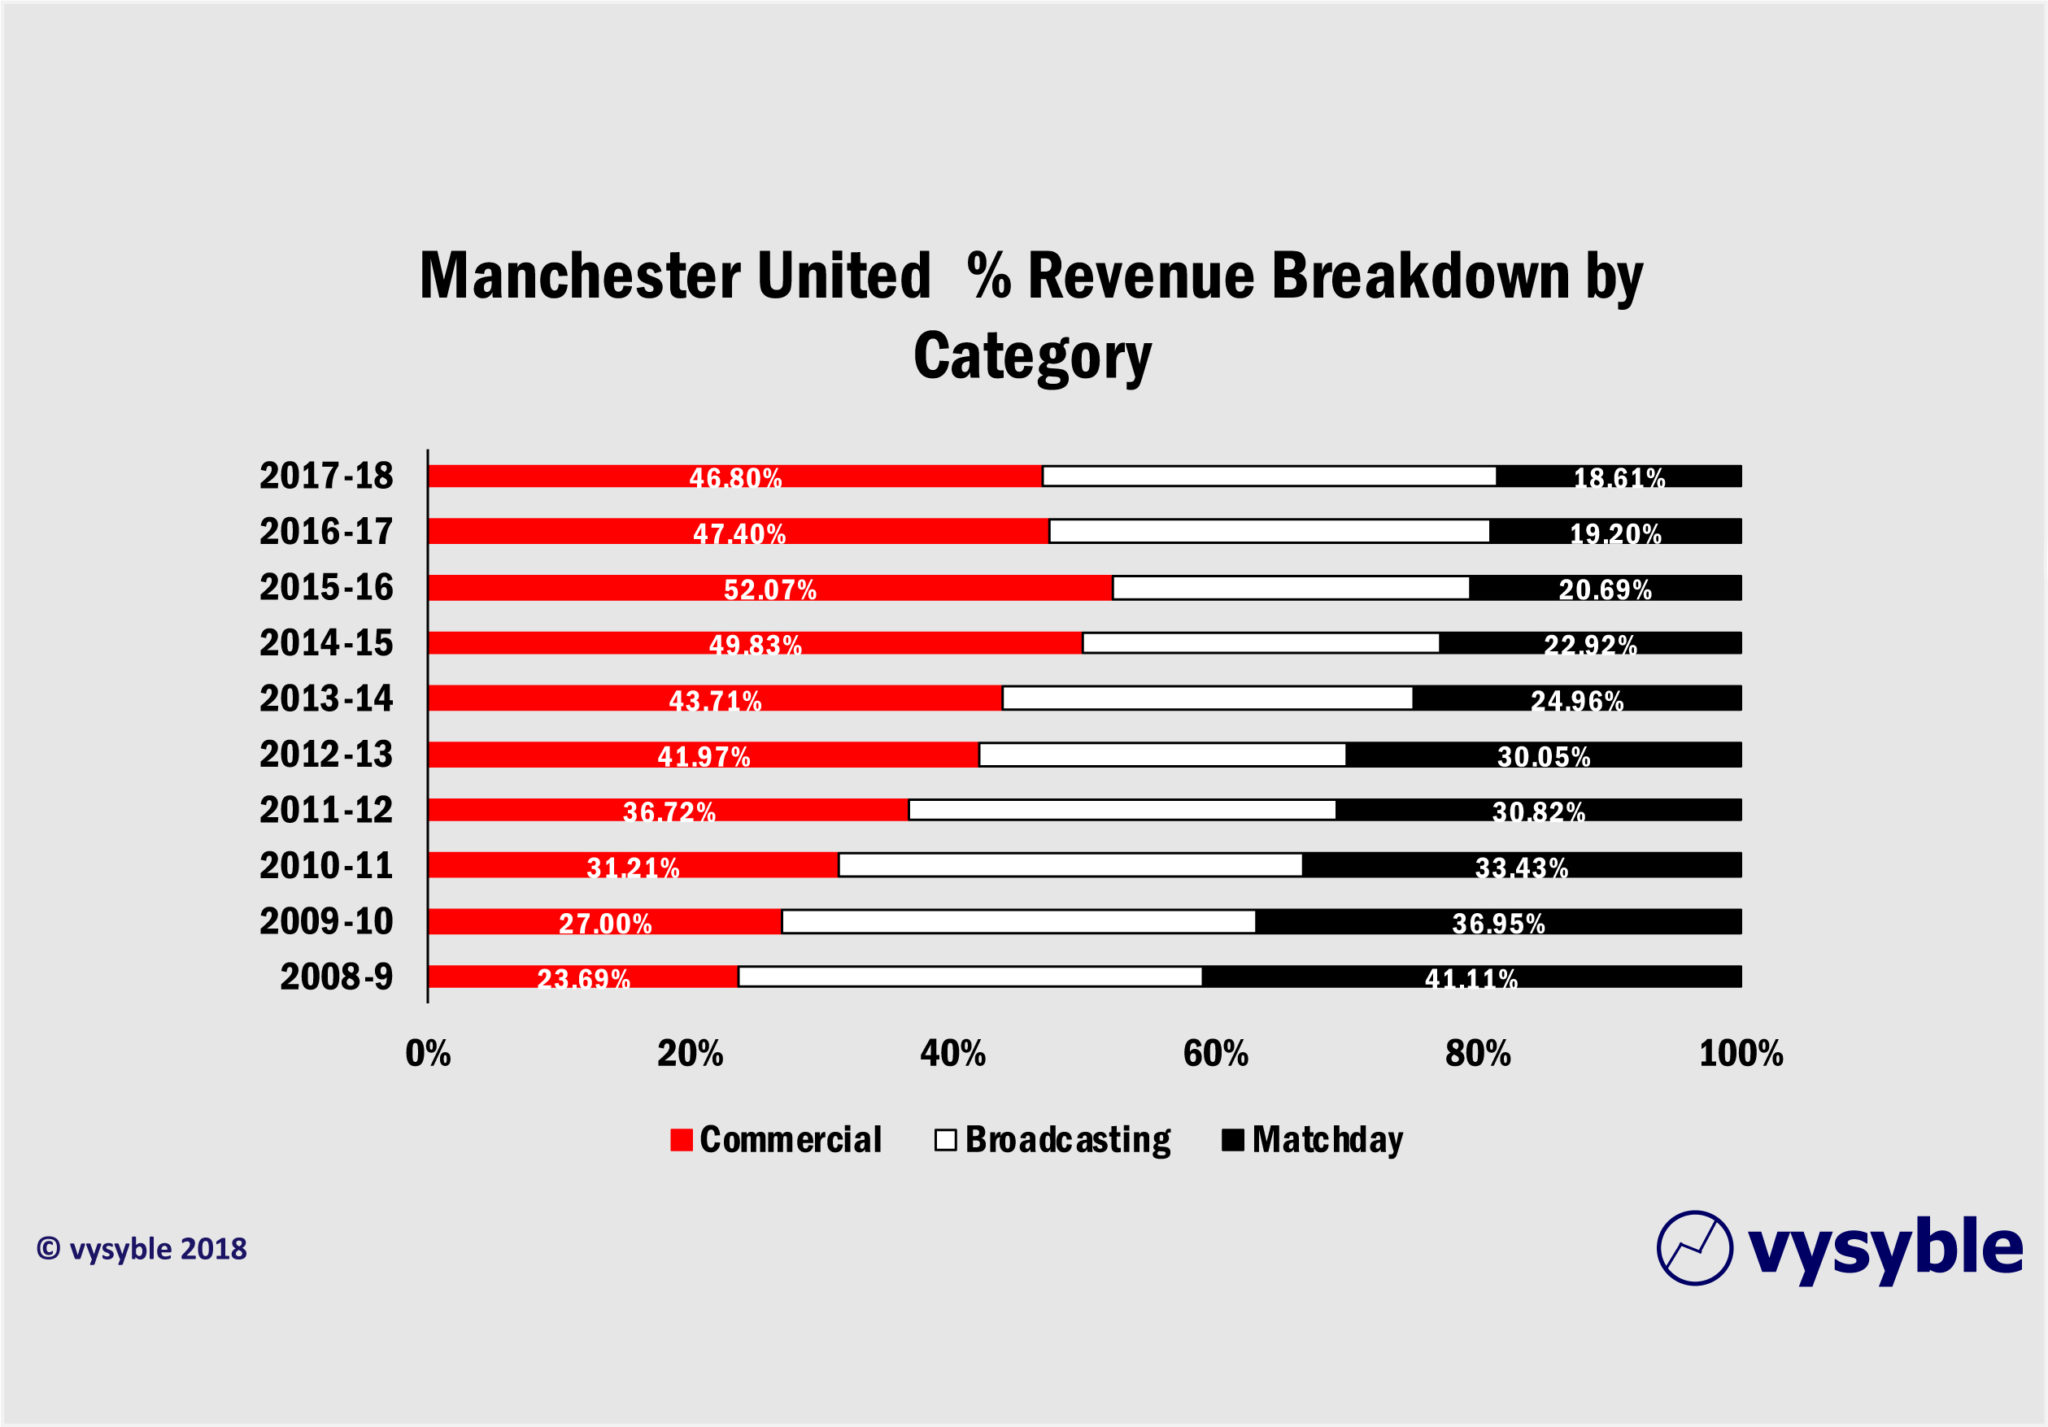
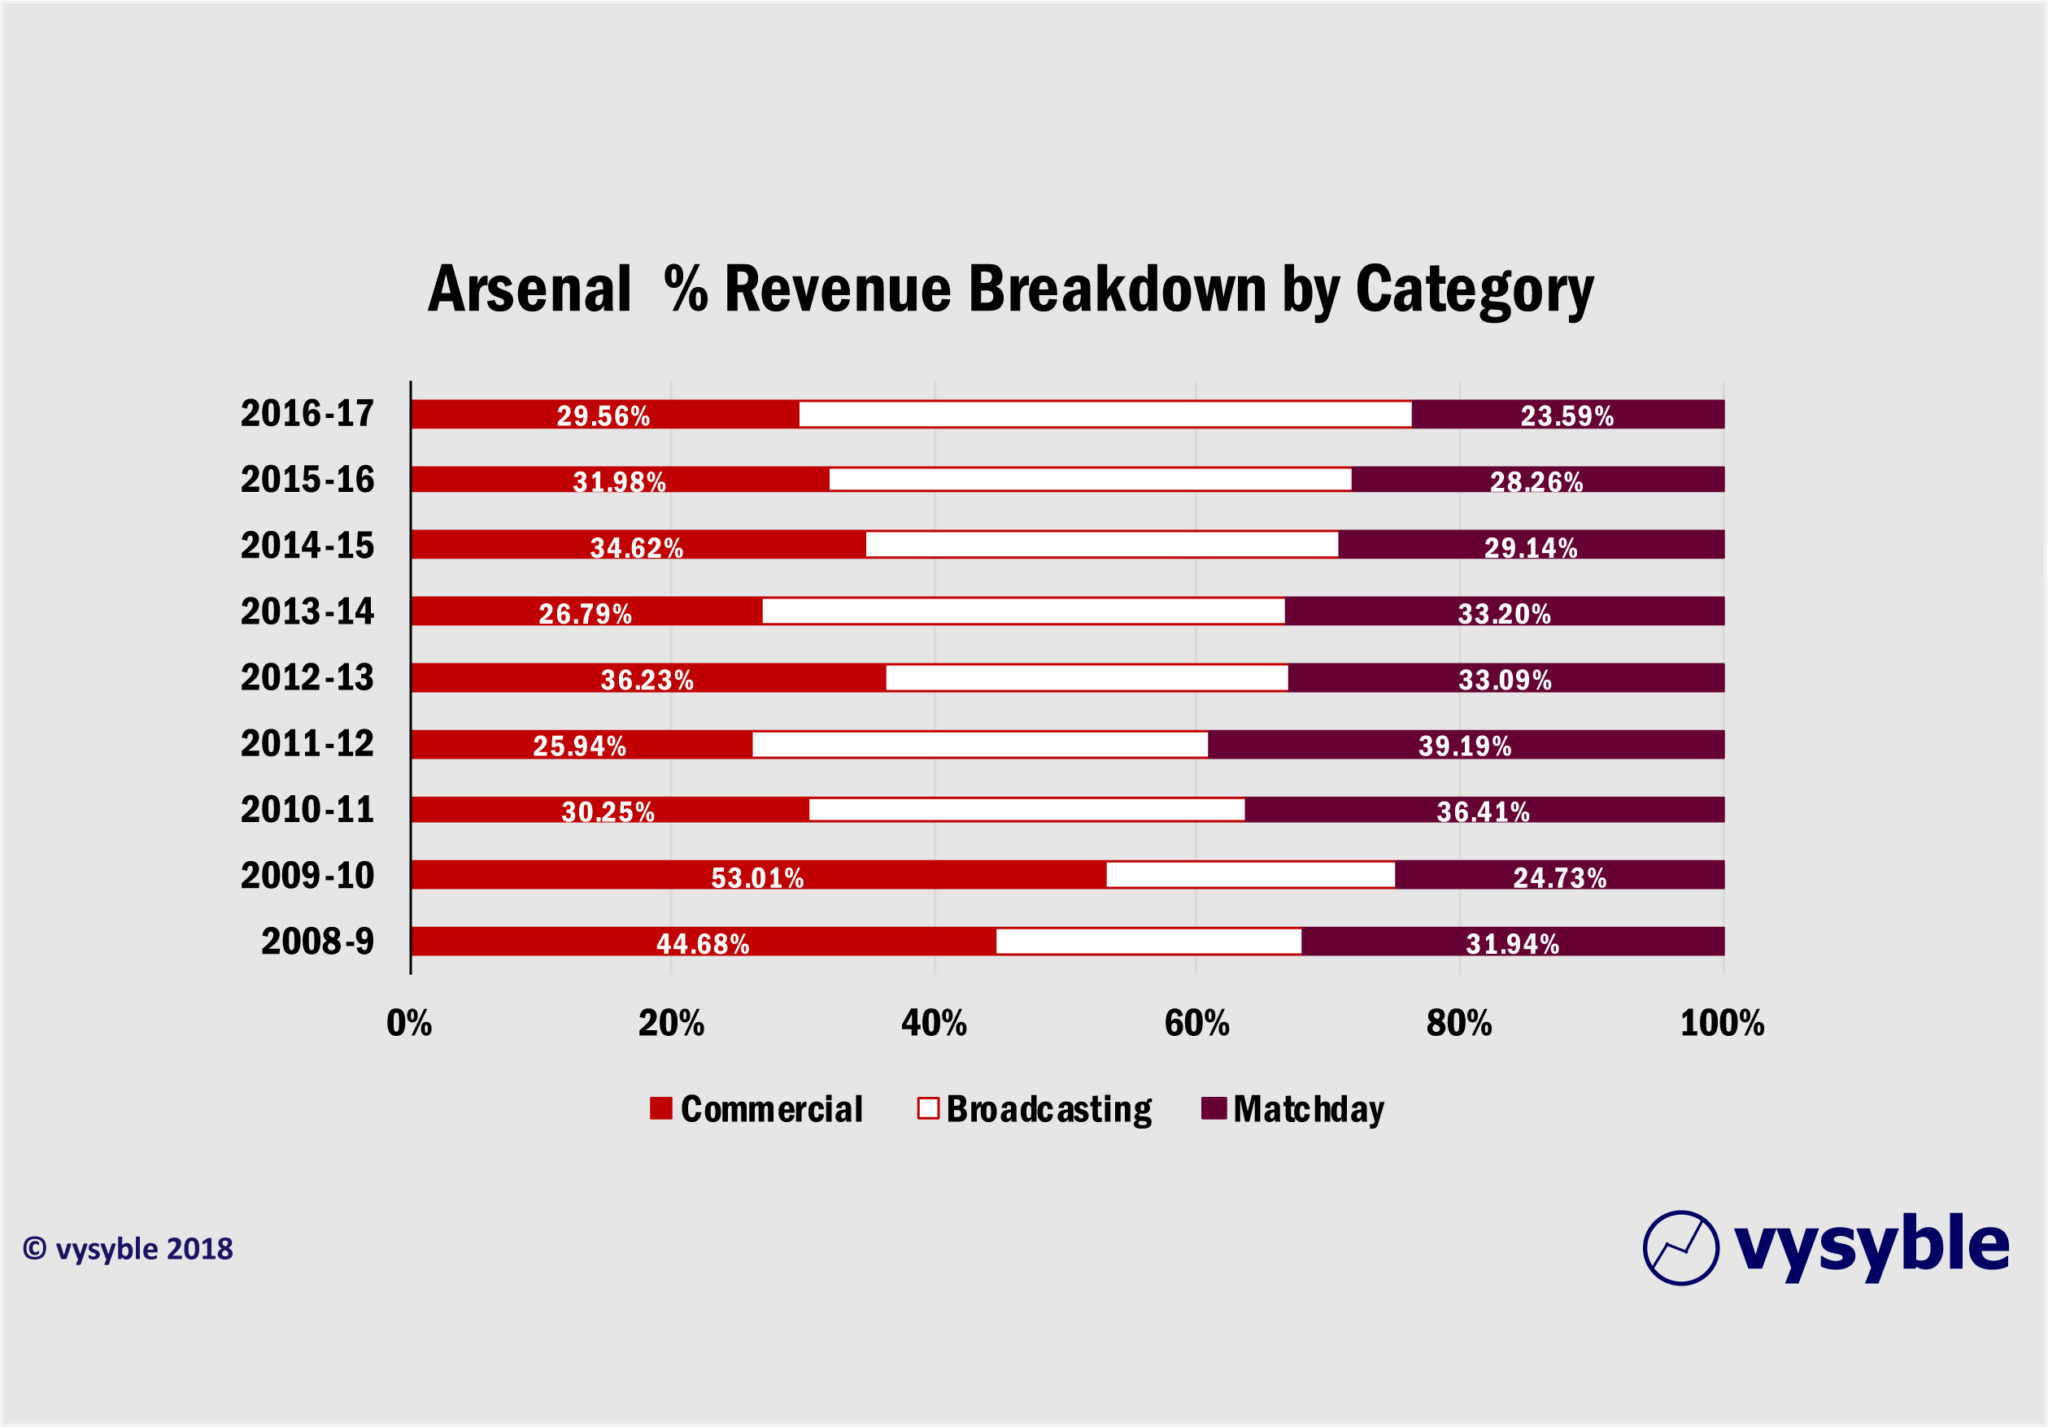
United has achieved remarkable and consistent commercial growth whilst reducing its exposure to media-related and matchday revenues. Arsenal has tended to rely more on broadcasting revenues but has not increased its commercial footprint to any major degree as a percentage of revenue. Jumps in commercial revenue share during 2008-10 and 2012-13 were principally down to property development activities rather than direct Arsenal brand development.
Also, there is a much bigger share from matchday revenue in Arsenal’s overall mix – the club does have the second highest season ticket cost in the Premier League at £1,768pa – which again highlights the commercial gap between the two clubs. United’s matchday share has dropped from 41% of revenue to just over 18% whereas Arsenal’s has dropped just over 8% points between 2009-17. Only in recent months have the Gunners made significant progress with a 5-yr kit deal worth £300m with Adidas and a £200m 5-yr sponsorship deal with Emirates from 2019.
Arsenal and United occupy first and third places respectively in the Pre-Tax profit performance league since 2010 for all clubs that have played in the Premier League. Arsenal’s performance has been particularly boosted by profits arising from the sale of Highbury and subsequent redevelopment. However, neither club makes large Pre-Tax profits from player sales.
Our business measure of choice is Economic Profit which, unlike the Pre-tax calculation, includes taxes and all charges associated with business operations including a charge for all capital used, which will also include equity capital. Thus the Economic Profit measure provides the most telling insight into business performance as it covers all costs incurred by the business.
Both clubs have achieved significant economic losses in the last 5 years, reflecting the increasing use of capital in day-to-day business operations. United’s prolific transfer spend since Sir Alex Ferguson’s retirement has partly necessitated the deployment of increased amounts of capital hence the £115m economic loss.
Arsenal’s economic losses have more to do with servicing and offsetting the outstanding debt arising from the construction of the Emirates stadium. The rate of economic efficiency in terms of turning revenue into economic profits/losses is marginally in United’s favour at an economic loss of -£6.96 for every £100 of revenue when compared with Arsenal’s -£7.51. Nevertheless, the latest economic loss of -£41.06m during 2017-18 for United is the largest the club has achieved in the last 10 years and may partly explain why transfer funds are not so readily available as in previous years.
Indeed, United’s position is one that has seen business costs rising faster than revenue since 2012-13, hence the recent regularity of achieving economic losses. Arsenal’s position is a stream of steady economic losses since 2010-11.
Whilst the Pre-Tax profits achieved by both clubs deliver an apparent picture of health, the inclusion of all costs and taxes paints a slightly different picture.
The net result is that we have two of the biggest clubs in the land finding it difficult to cover all the costs of doing business, despite record revenues from TV deals and sponsorships. It is certainly not a terminal position but does provide an insight into the deeper workings of the Premier League clubs’ general inability to be truly profitable and a nod towards the motivations of different and potentially more lucrative competition formats eg European Super League.
The financial rewards from Champions League football therefore take on an increased level of importance when viewed against the economic performance of both clubs. For instance, we expect Liverpool to post bumper profits for 2017-18 as a result of its performance last season in Europe (along with the proceeds from selling Coutinho), hence the club’s record net summer transfer spend of £146m earlier this year.
Both United and Arsenal could do with the same injection from Champions League football given their respective financial performances. Wednesday evening’s fixture has added importance as dropped points could have major financial implications especially for United with increased distance from a lucrative Champions League berth being a real possibility.
The position of both clubs across the four key measures of Revenue, Staff Costs, Pre-Tax Profit and Economic Profit is summarised in the following graphics:

