12th January 2017
Shopping for Godot
It is that time of year when the retailers release their sales numbers for the six weeks leading up to Christmas. Like enthusiastic disciples making a pilgrimage to the Temple of Delphi, such numbers are seen as an indicator of the strength of consumer spending, the UK economy and whether the strategies of the respective companies are on track or not. A heavy burden for a single number to carry!
Often some poor unsuspecting retail expert is dragged into a television studio to offer “profound insights” into the health of the retail sector – largely on the basis of a number that, amongst other things, takes no account of the capital required to generate that number.
Indeed Tesco, following on the heels of Morrisons and Sainsbury earlier this week, announced their year-on-year sales progress – amounting to a 0.7% sales increase for the six weeks ending on the 7 January 2017.
The Guardian newspaper had the following quote;
“Richard Lim, the chief executive of consultancy Retail Economics, said Tesco’s turnaround continued to gather momentum. “Its laser-like focus on the core UK food business through deeper price investment and further asset disposals has halted the loss of market share against the smaller but faster growing discounters,” he said.”
It is an interesting comment, resting on the in-going assumption that “recovery” and the scale of market share are natural bedfellows in all contexts. Whilst potentially beguiling from a shareholder perspective, it is in serious danger of forming only one half of a rather more complex story.
A market share objective will result in market share priorities and behaviours which, may or may not be alignment with a shareholder value objective – it is perfectly possible to increase market share whilst at the same time destroy shareholder value. Certainly there is more than persuasive evidence that Tesco’s dash for market share, almost at any cost, is a significant factor behind their current very challenged predicament. Sadly, it is their investors rather than the “informed expert” that bear the brunt of this strategic folly. As Warren Buffet said;
“Growth is simply a component – usually a plus, sometimes a minus – in the value equation.”
Berkshire Hathaway Annual Report, 2000
The bigger question as to whether Tesco’s recovery is on track requires more than just speculation and opinion. We prefer to look at the numbers and more particularly as to how Tesco’s Market Value Added (MVA) has moved over time. Just to be clear:
MVA = Enterprise Value minus Invested Capital
Therefore, MVA represents the market’s collective view of the future stream of economic profits at a given point in time for a given share price.
Enterprise value is calculated as the market capitalisation plus debt, minority interest and preferred shares, less total cash and cash equivalents.
Invested Capital is defined as Total Assets less short-term non-interest bearing liabilities.
By subtracting one from the other we get a perspective on the capital market’s view on the Tesco recovery.
The following calculations have used the data available, principally the company’s balance sheets, at the relevant time; the most recent calculated numbers for January 2017 use the 2016/17 half-year balance sheet which is not ideal but it is the latest set of available data.
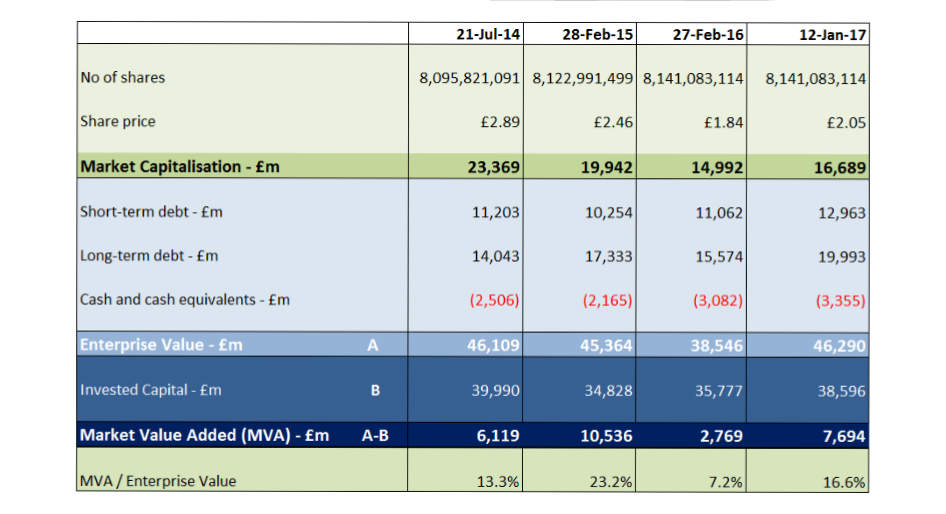
We have chosen 21 July 2014 as this was the point when the previous CEO, Mr. Philip Clarke, was replaced. The share price at this chosen time was £2.8865.
Indeed, the exercise above proves the validity of looking at the MVA position rather than the more commonly-viewed market capitalisation approach. Although market capitalisation has fallen by £3.427bn between 21 July 2014 and 28 Feb 2015, the reason why this is so is principally due to the decline in the Invested Capital balance, which fell by £5.162bn. MVA, the market’s view of the future stream of economic profit, rose by £4.417bn (ie £10,536m-£6,119m).
Unfortunately, it can be argued that the recovery has somewhat stalled despite the recent rise in the share price. Although clearly better than last year, current MVA based on the last half-year (2015/16) balance sheet – and a share price of £2.05 – stands at £7.694bn, which is £2.842bn less than the MVA balance of two years ago (£10.536bn) when the “new” strategy was announced.
The company may have convinced several analysts that it has a value-maximizing strategy for shareholders but let us not forget that analysts may not adopt the same collective view as that of the capital markets and from our calculations and from the share price performance, it would seem that the “recovery” is not as established as some would have you believe.
vysyble