The Football Profitability Index (FPI) enables comparison between football clubs on a like-for-like basis in terms of their efficiency in achieving Economic Profit (EP) from revenue.
It is an important measure because it uncovers some of the underlying fiscal trends hidden by the standard measures such as pre-tax profit. The question of whether or not clubs are becoming more or less efficient in processing their revenue and all deployed capital cannot be answered by taking the accountancy perspective which includes measures such as EBITDA, pre-tax etc.
We express the relationship between revenue and the EP number by calculating an EP/R value® which, very simply, is the Economic Profit or Loss number divided by the revenue number ie EP/R .
The EP/R value number is also referred to as the FPI number/value.
Some of those hidden trends have huge consequences. For example, between 2014-18 the club with lowest FPI value outside of the ‘Big 6’ Group of clubs (Arsenal, Chelsea, Liverpool, Manchester City, Manchester United and Tottenham Hotspur) has been relegated back into the Championship.
And within the Championship itself, clubs with the lowest FPI values are being promoted on an increasingly regular basis which does not bode well at all for their financial futures. Therefore we can, with some confidence, state that the inefficient use of capital and resources is influencing on-pitch performance.
So how does it work? We take all of the FPI values for the individual football clubs and recalibrate the numbers to a specific benchmark in order to create the index.
We use an index value of 100 to reflect a break-even position ie FPI values of 100+ will reflect an economically profitable performance whilst FPI values under 100 will reflect an economically negative (and thus loss-making) performance.
Set out below is the the ranking of Premier League clubs by FPI value for the 2016-17 season. Please note that the most economically efficient club is not necessarily the most successful on the pitch as determined by overall league position.
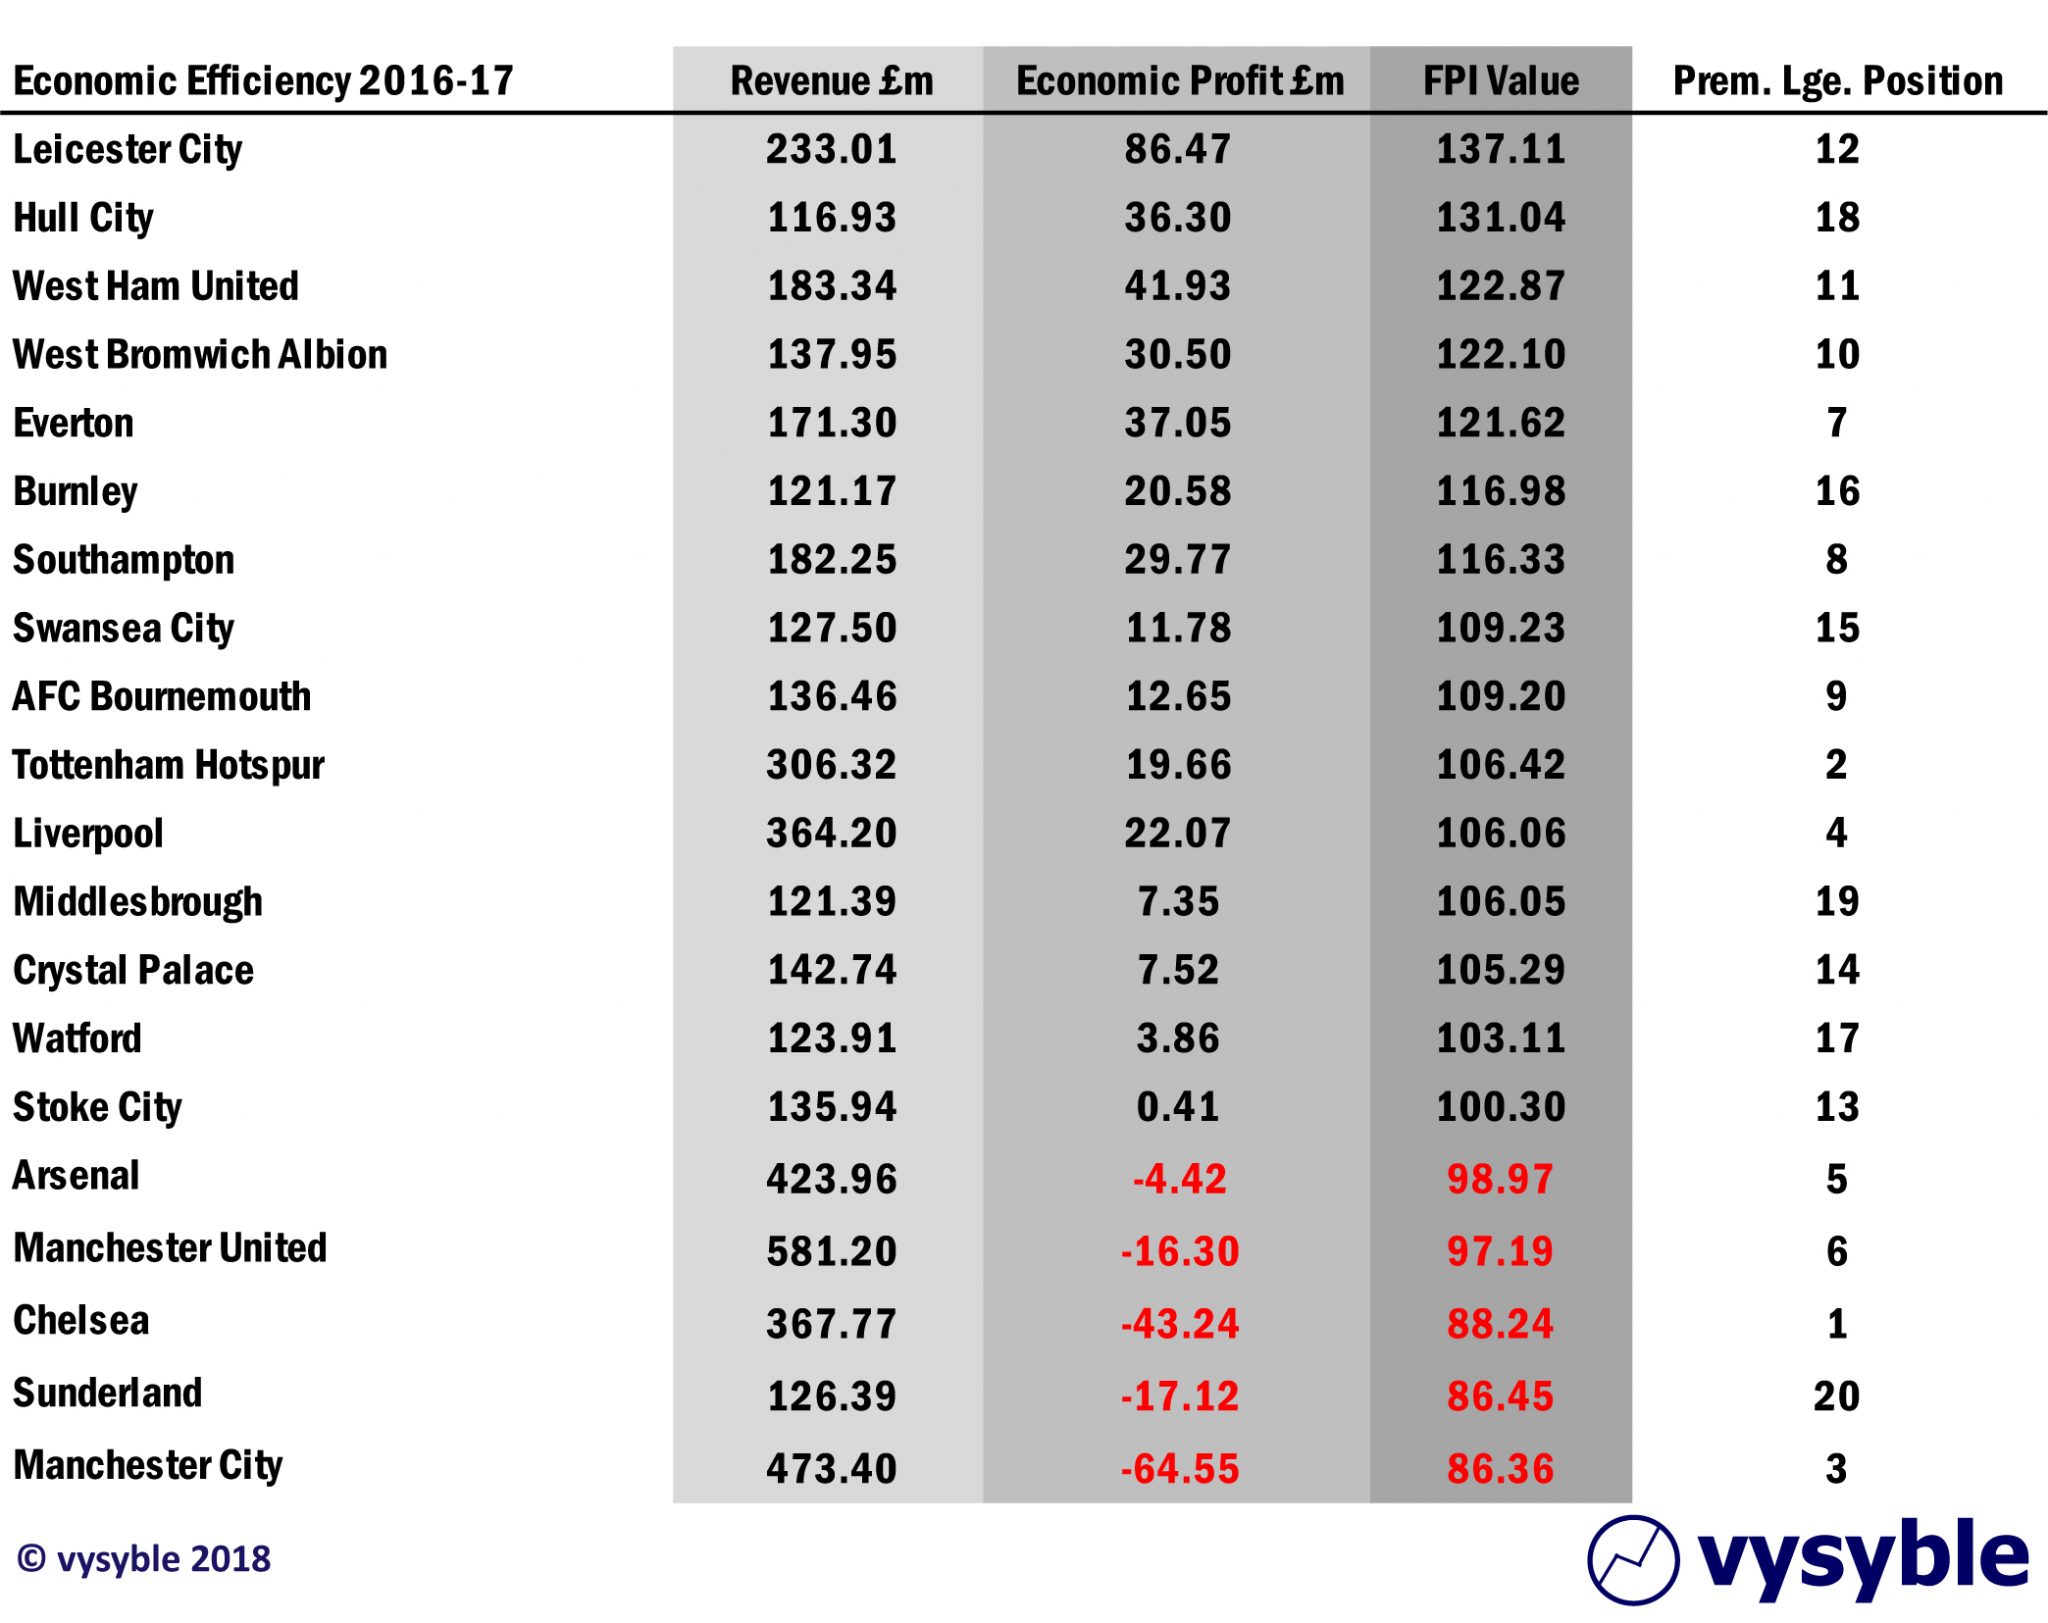
Leicester City, Premier League champions in 2015-16, achieved significant economic profits of £86.47m in the following season as indicated and also managed to attain the position of being the most economically efficient club whilst doing so.
Leicester City’s FPI value of 137.11 can interpreted as follows; for every £100 of revenue, the club achieved an economic profit of £37.11 ie 137.11 – 100.
Therefore we can also tabulate FPI values to reflect Economic Profit or Loss performance per £100 of revenue.
Contrast this with Manchester City at the bottom of the table. The club’s FPI value is 86.36. As this value is below the breakeven mark of 100, the club clearly achieved economic losses during the season in question as indicated in the table.
Manchester City’s economic efficiency per £100 of revenue can be calculated in a similar manner to that of Leicester City ie FPI value – 100. Therefore, in Manchester City’s case, the calculation can be expressed as 86.36 – 100 = -£13.64.
In other words, Manchester City was achieving economic losses of £13.64 for every £100 of revenue earned during the 2016-17 season.
A direct comparison between the two clubs shows that there is a £50.75 per £100 of revenue differential in economic performance ie £37.11 – -£13.64, partly reflecting the success of the East Midlands club in European competition versus the continuing capital investment in Manchester City by its owners.
Furthermore, Chelsea won the Premier league title in the 2016-17 season whilst achieving economic losses of –£11.76 per £100 of revenue and ended up in 18th place in the economic efficiency rankings. Indeed, only Manchester United and Leicester City have won a Premier League title and achieved an economic profit in the same season since 2009; 7 out of the 10 most recent titles have been achieved by a club making economic losses in doing so.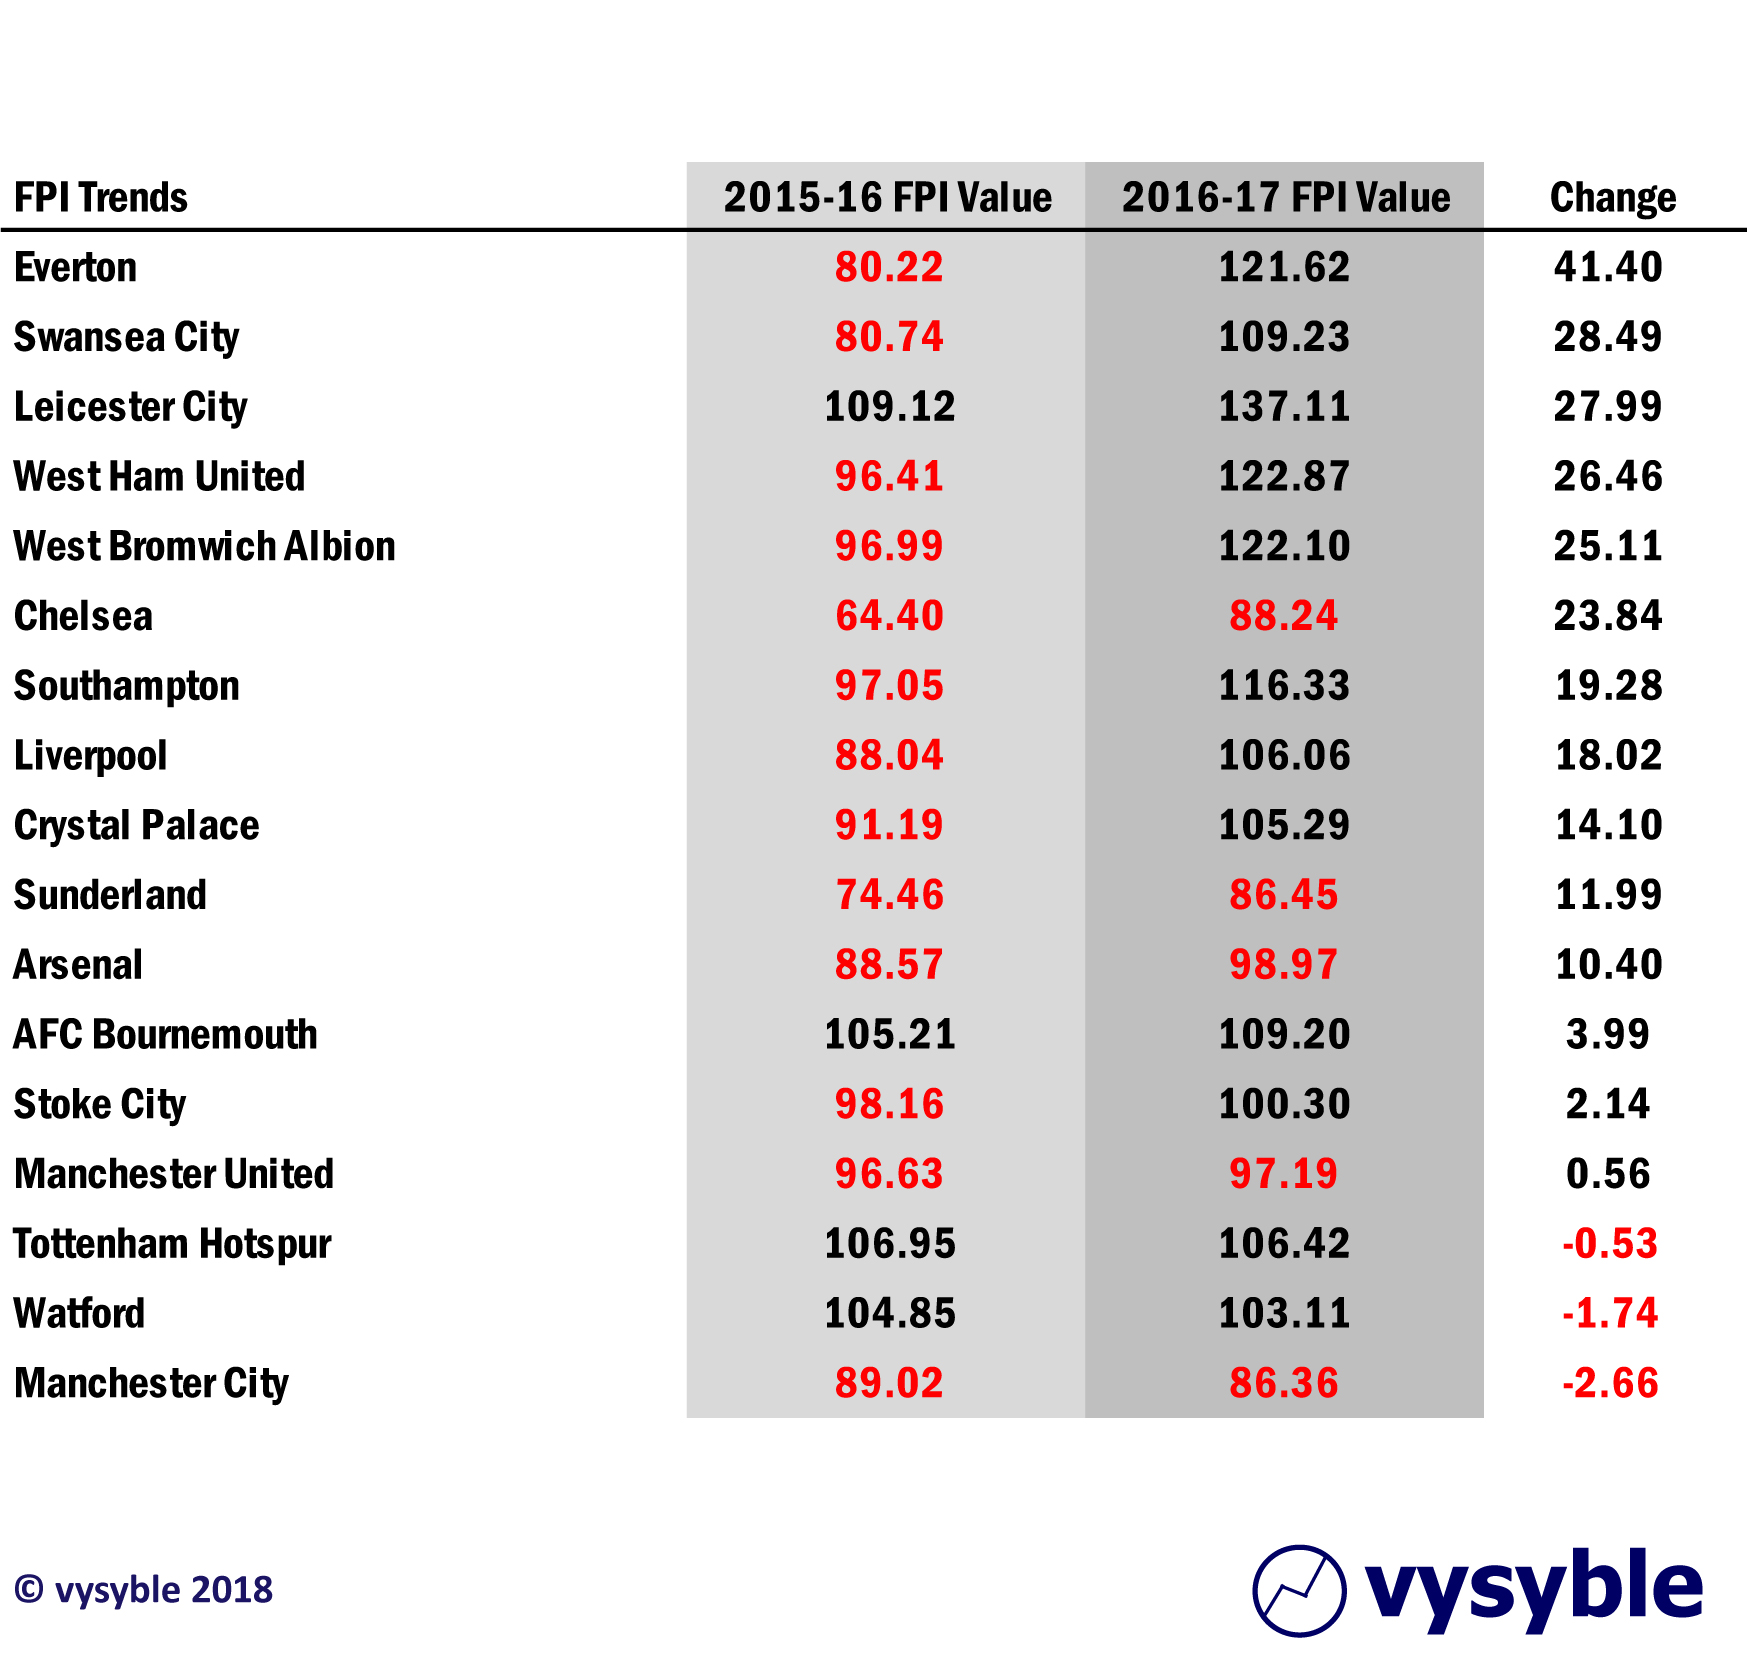
The second table above highlights the influence of the 2016-19 domestic TV deal on the economic fortunes of clubs that played in the Premier League in both the 2015-16 and 2016-17 seasons. Barring four of the ‘Big 6’ clubs plus Sunderland which had been dogged by financial issues in previous seasons, the remaining clubs achieved economic profits in the first year of the new TV deal in 2016-17 with some experiencing significant change as a result of this and other influencing factors including the participation in European competition, profits from player sales and a ground sale (West Ham United).
What can the FPI tell us?
-
The most economically inefficient Premier League clubs generally reside in the ‘Big 6’ grouping by revenue and league position.
-
The club with the lowest FPI value outside of the ‘Big 6’ group is usually relegated.
-
A declining FPI value trend over time (3yrs+) usually results in relegation to the Championship for clubs outside of the ‘Big 6’ group.
-
Championship clubs vying for promotion are posting lower FPI values year-on-year.
-
Both Brighton & Hove Albion (2016-17) and Wolves (2017-18) were promoted to the Premier League with the lowest FPI values in the division.
-
We are starting to see the emergence of the same Championship promotion race FPI dynamics in the Premier League as certain clubs vie for the financial uplift associated with Champions League qualification.
More significantly, the FPI highlights the financial impact and fallout of the Premier League’s smaller clubs trying to compete with the larger clubs. The following graphic highights the change in FPI measured in £ per £100 of revenue on a year on year basis and split between the ‘Big 6’ group of clubs and the remaining 14 group of clubs.
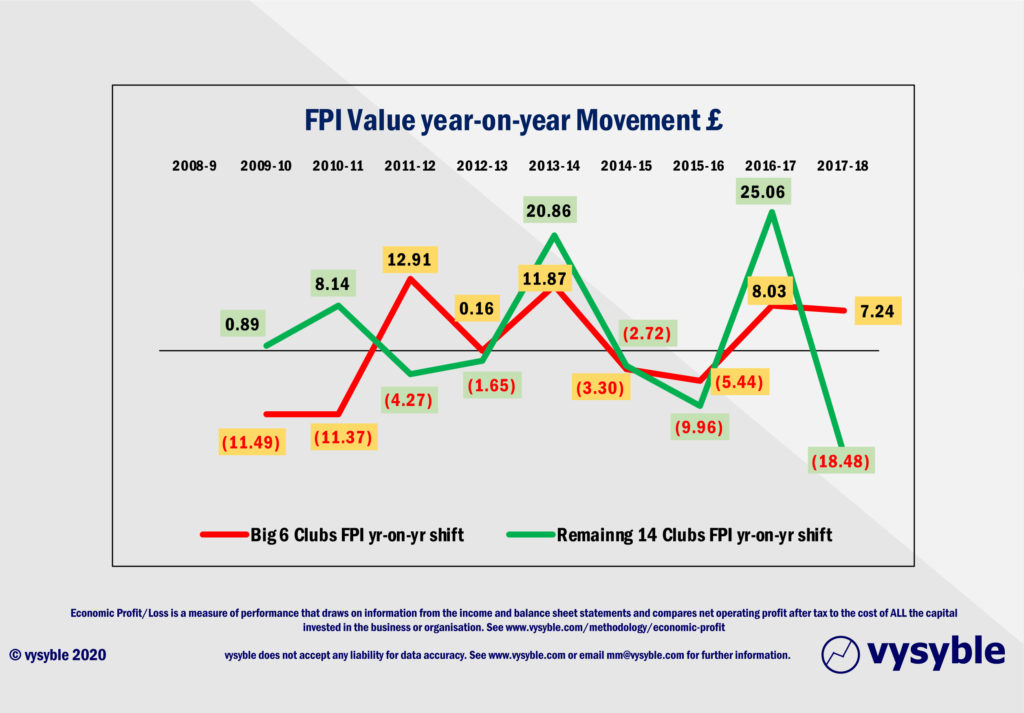
In 2010-11, 2013-14 and 2016-17, the remaining group of 14 clubs experienced significant increases in its overall FPI value as the first year of each new TV cycle began. However, the fall in its FPI value in the subsequent 2 years is noticeable and frankly astounding in the case of 2017-18 with an economic profit decline of £18.48 for every £100 of revenue.
The graphic also highlights the economic contrast between the Big 6 clubs and the rest of the division in that the Big 6 enjoy a relatively stable existence as determined by the narrow amplitude of FPI rises and falls since the introduction of Financial Fair Play in 2012. Conversely, the remaining 14 group of clubs have experienced increased volatility in their economic efficiency with extreme and widening highs and lows over the same period.
For any Owner or Chief Executive of a club outside of the Big 6, the Football Profitability Index data provides additional and compelling insight into the financial challenges and associated dynamics within the top flight of English football. This additional and unique perspective also sheds further light on the scale and depth regarding football’s financial gambles.
Follow vysyble on Twitter