17th September 2019
Perhaps the recent relegation of M&S from the FTSE 100 is in part a reflection of how much the shape and composition of the UK economy has changed over the last 30 years. At one time the fortunes of the company were often viewed as a barometer for the wider health of the UK economy. The long-lamented “The Money Programme” once ran an extended feature on the opening of an M&S store in Paris and how “sophisticated Parisians” were expected to react to a more mainstream “British” retail offer.
At the time, the company almost seemed imperious in the British high street. Unaccepting of credit cards other than its own, with a seemingly comprehensive understanding of the competitive environment and a reputation for quality at an acceptable and affordable price. In business schools around the world, MBA lecturers and students looked upon M&S as a model case study in how a company can get it right.
Against this background one might think that ejection from the FTSE 100 is a development largely as a result of the hyper-competitive and fast-changing environment which has engulfed British retailing, the force of which no management team could possibly withstand. Indeed, some might argue that this is nothing more remarkable than Schumpeter’s “creative destruction” whereby the composition of the FTSE 100 changes as the marketplace and business environment moves on and transforms.
Work published by Schroders (How the FTSE 100 has changed over 33 years – David Brett, 30 June 2017) reveals the following;
“From the time of its inception in 1984 at 1,000 points, just 28 of the original 100 remain listed on the index. UK-focused businesses and conglomerates have been replaced by international juggernauts.”
In other words, 72 of the UK’s largest companies back in 1984 are no longer part of the FTSE 100 index which, incidentally, is 2.6x the number of original constituent companies remaining within the FTSE 100. Notable ejections across a variety of sectors include:
- Boots
- The Burton Group
- Cable & Wireless
- Cadbury Schweppes
- British Home Stores
- Grand Metropolitan
- Hanson Trust
- Hawker Siddeley Group
- Northern Foods
- Scottish and Newcastle
- Trafalger House
- United Biscuits
- George Wimpey
Some of the companies leaving the FTSE 100 have been removed due to mergers, de-mergers or an acquisition. For example, Boots which was founded in Nottingham in 1849 was taken private in 2007 when it was bought by a Swiss Private Equity organisation (Kohlberg Kravis Roberts) and Stefano Pessina.
However, there is a danger that when viewed through this perspective, one might conclude that there is a degree of inevitability regarding continuing participation in the FTSE 100.
It should be emphasized that some companies have come out of the FTSE 100 due to poor management and strategy implementation.
The performance of M&S in terms of shareholder returns and profits is revealing. For example, a view of the company’s Total Shareholder Return (TSR) performance against the FTSE 100 index and Next plc reveals its sub-par trend vs the FTSE 100.
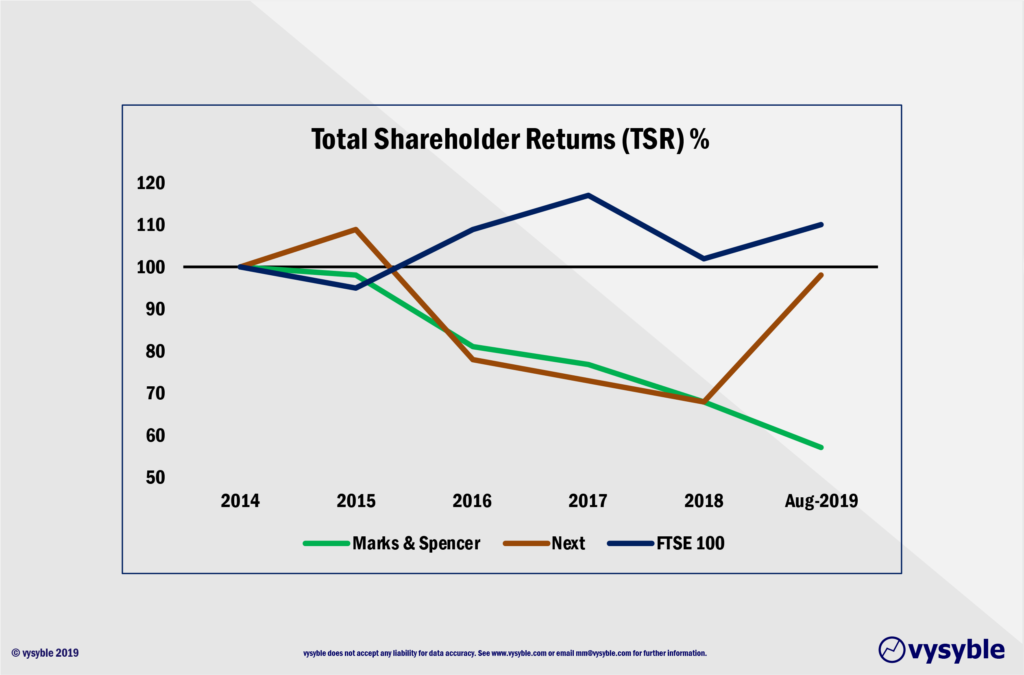
Since the end of 2014, the M&S TSR has lagged the FTSE 100 whilst in recent months Next plc, arguably a competitor, has forged ahead. Given the length of time that M&S has lagged the FTSE 100, ejection from the index is neither a surprise nor particularly sudden.
Indeed, various profit measures reinforce the gloom.
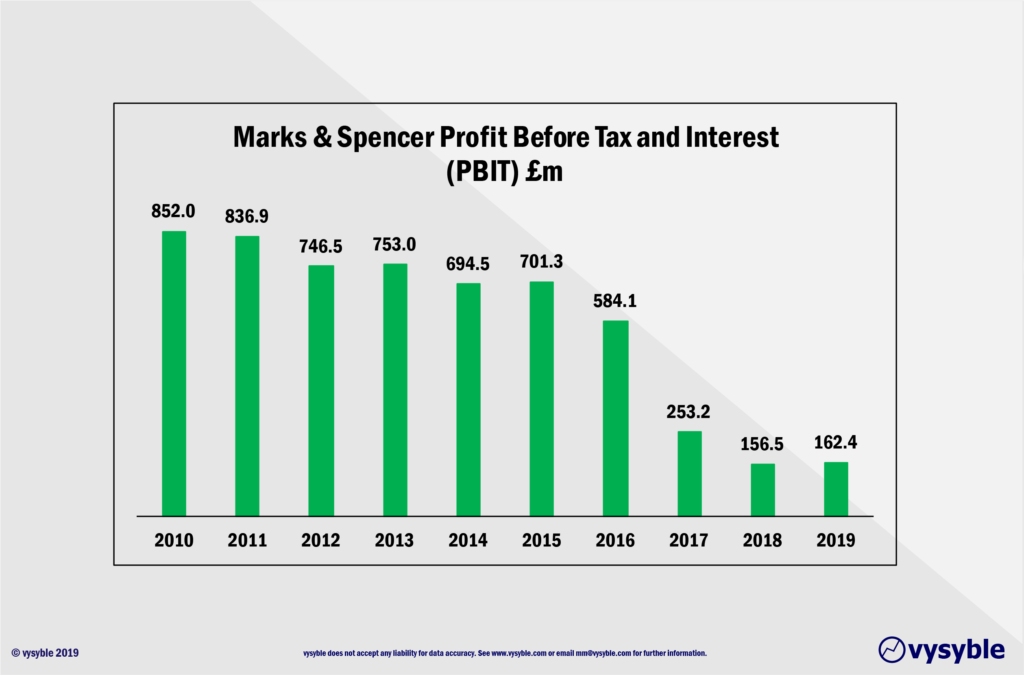
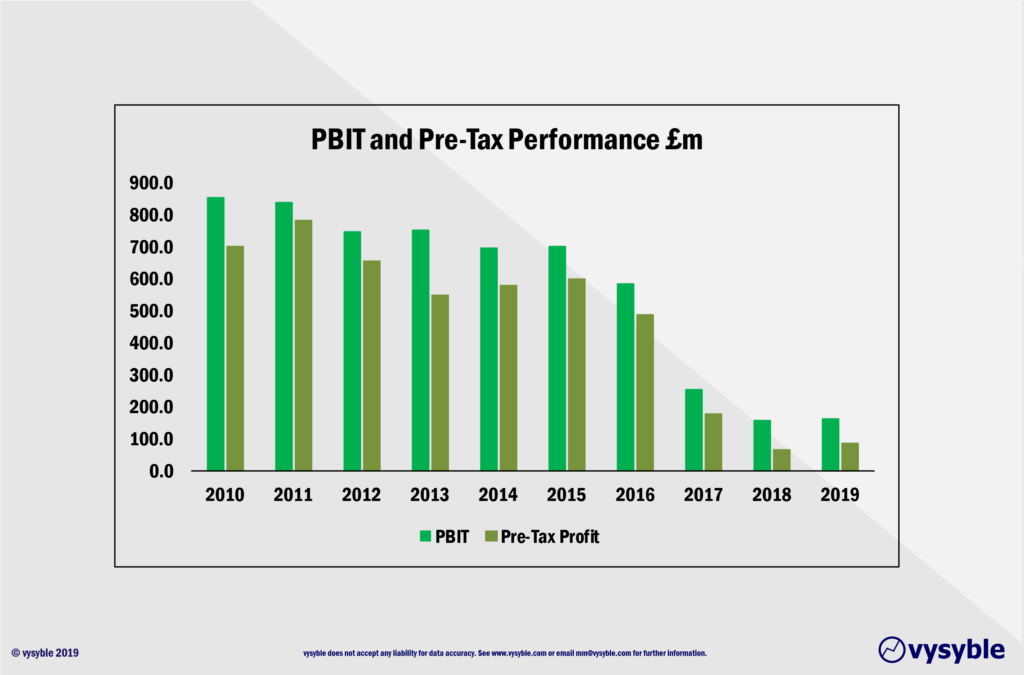
Despite the falls in PBIT and Pre-Tax profits, the company is just on the right side of the line as defined by both measures albeit on much reduced scales. The picture changes significantly when all the costs of business are taken into consideration via the Economic Profit measure.
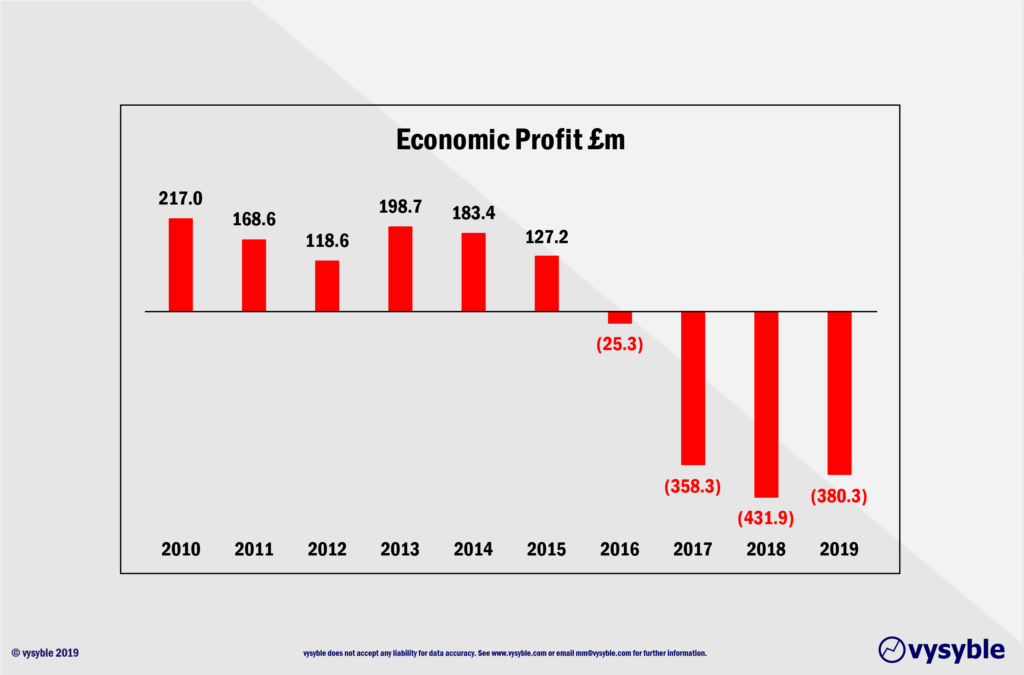
This is a more worrying picture of performance. Over the last four years, the company is not covering all of the costs of doing business. Economic Profit (EP) has fallen from a position of value creation in 2010 with an economic profit of £217m to an economic loss of £380.3m in 2019. Since 2016, the business has not been covering all of its costs of doing business.
From experience, we suspect that there are value creators and value destroyers within the portfolio, which do require different strategic remedies. In fact, applying the same strategic agenda for the value-creating part of the portfolio to the value destroying elements would in all likelihood make the economic position even more challenged.
If the management team is viewing performance through the inferior PBIT lens, there is a high likelihood that any strategic remedies or alternatives would either be wrong or at best be counter-productive.
Therefore, clarity of value creation and destruction using the correct metrics across the portfolio is vitally important to the successful development of the company’s strategic agenda. For a variety of reasons, we believe that economic profit, when applied to all of the company’s activities over time, provides that clarity.
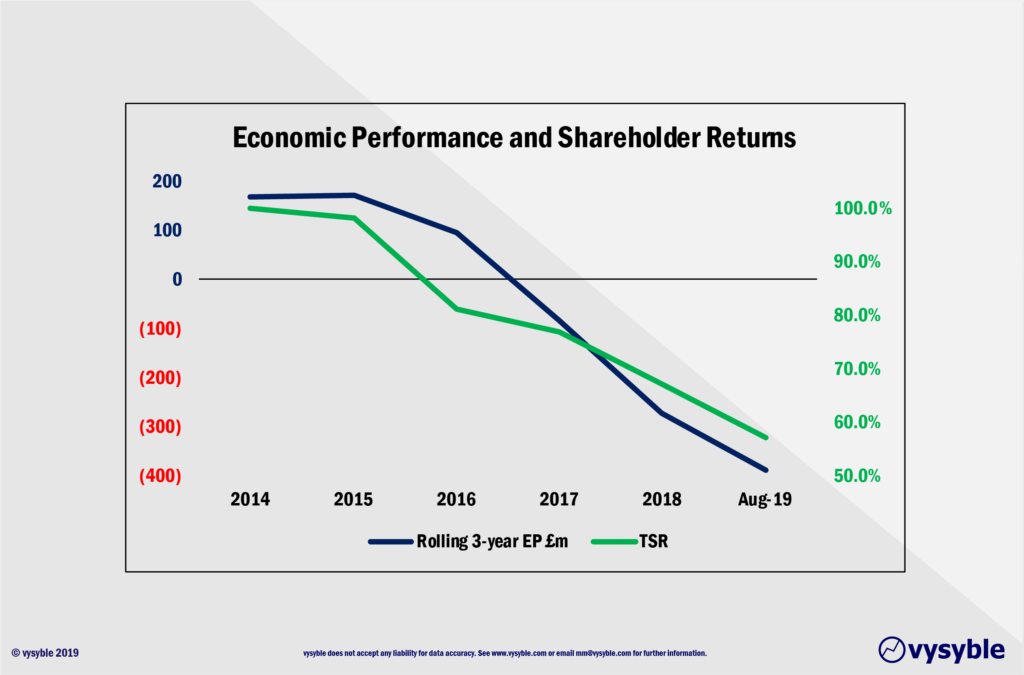
In the graphic below, we observe a relationship between the rolling three-year economic profit performance between 2014 and 2019 and the total shareholder return (TSR) of the company on the capital markets. This graphic strongly suggests to us that the capital markets are using current or recent performance as a base for their future expectations.
Given the decline in economic profit and TSR performance, one might expect a significant fall in gross margin over the period.
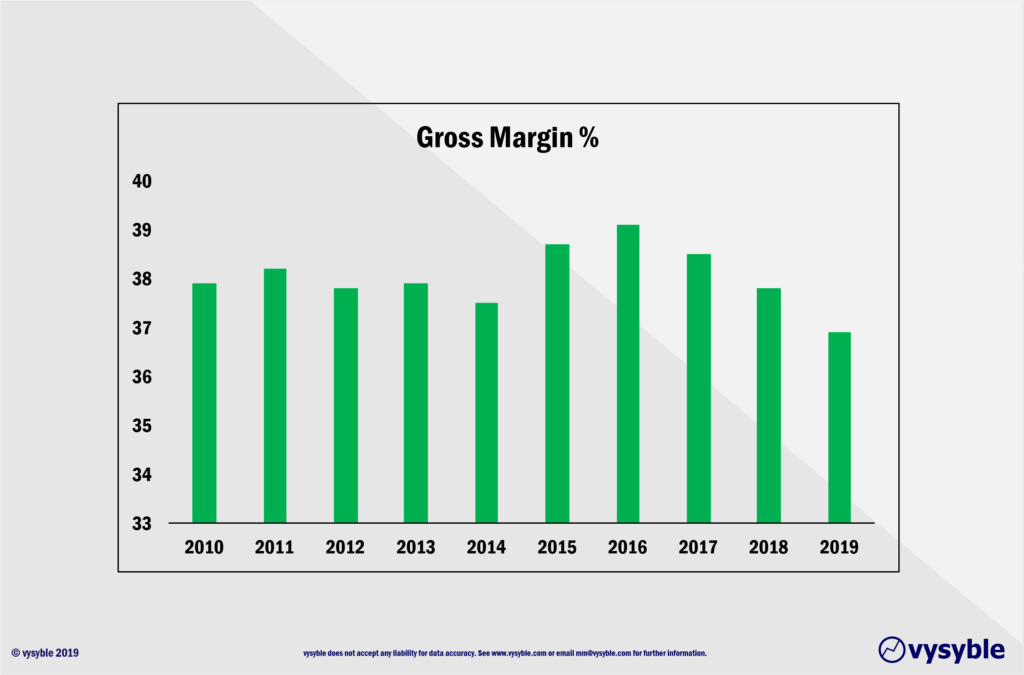
Not necessarily so. The gross margin level would appear to be reasonably steady.
Given the above, it is therefore fair to conclude that the decline in the company’s economic performance is not due to any pernicious fall in gross margin, certainly when using 2010 as a benchmark. However, revenue in 2019 totalled £10.4bn against £9.5bn in 2010. The economic profit performance of the business from 2015 is illustrated below.
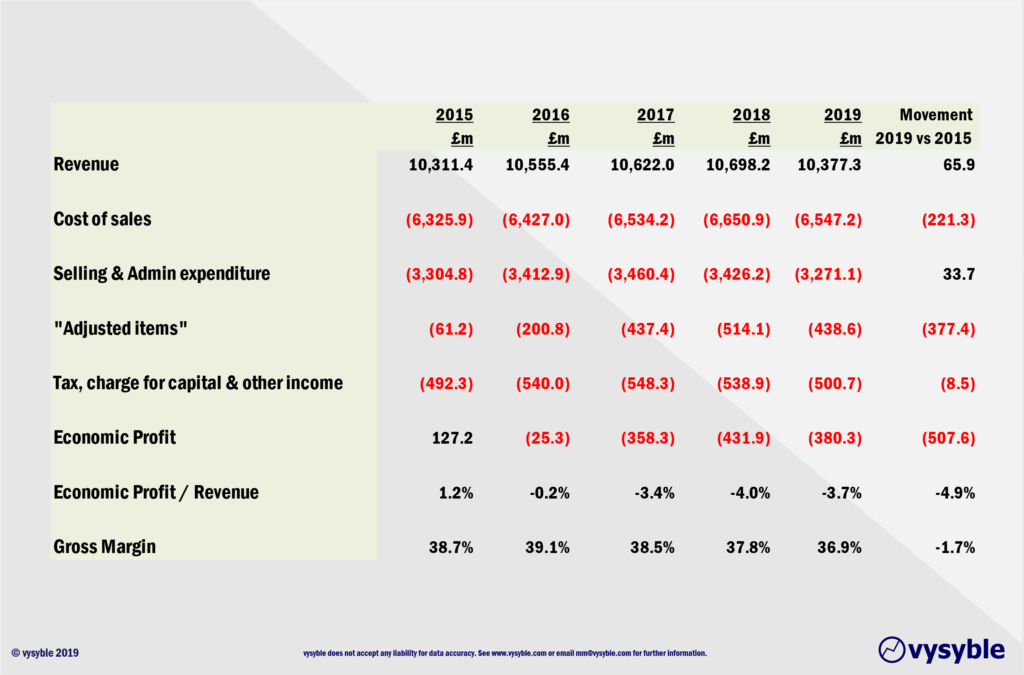
From the annual reports, it is difficult to uncover the reasons for the indicated “Cost of sales” increase totalling £221.3m between 2015 and 2019. However, there is excellent disclosure regarding the “Adjusted items” line whereby expenditure has exceeded £400m in each of the last three years and over the last five years has reached £1,652.1m (£1.65bn). We have also included 2014 in the graphic below to give a sense of perspective with regard to the growth in such ‘items’.
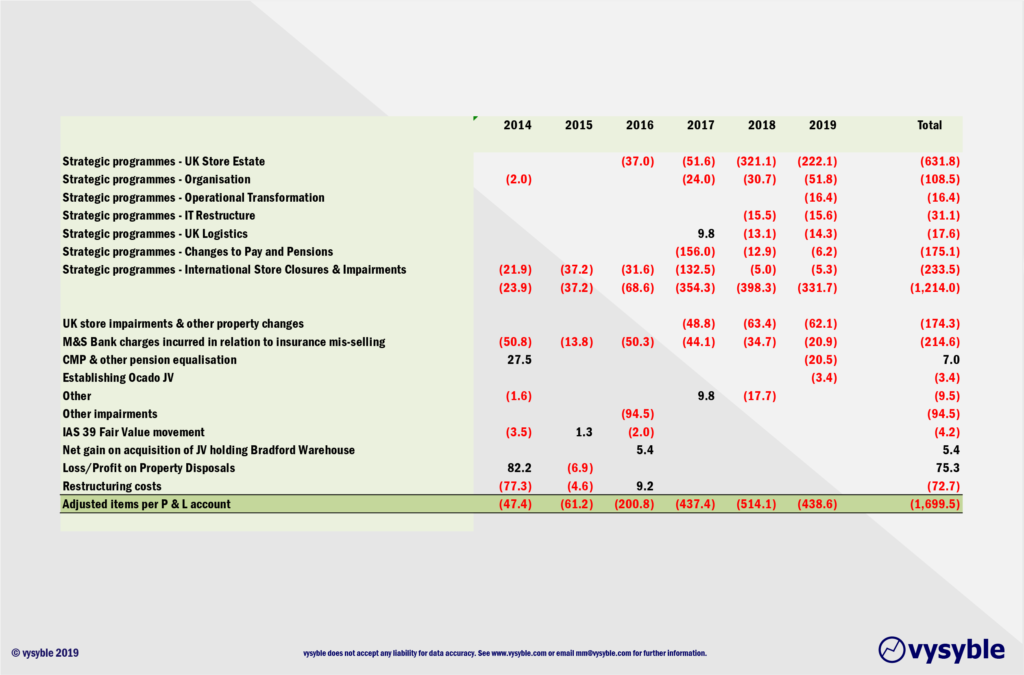
Like most things in life there is an issue of balance. Having expended £1.21bn over the last 6 years on “Strategic programmes” as part of the overall £1.69bn spend on “Adjusted items”, it would be difficult to accuse the management team of not taking the challenge ahead seriously. Furthermore, they could be looking to “clear the decks,” and get the hard strategic choices over and done with whilst leaving the economic performance to improve over the coming years.
We certainly hope so. The most recent Annual Report (2019) points towards change and improvement, as stated by M&S Chairman Archie Norman.
“Highly capable management teams have come and gone with perfectly sensible plans and the long-term downward trajectory of the business has continued. Our failure to adapt, despite rapidly changing markets, means M&S now stands on a burning platform. So we are aiming to transform all the pieces of the jigsaw: the way we are organised, the way we work, our technology, our store base, our product, our supply chains and our value in the market.”
Whether the advice or the progress made is effective will ultimately be a judgement call for both the customer and the capital markets over time. Hitherto the initial signals are not as positive as perhaps the senior management team would like:
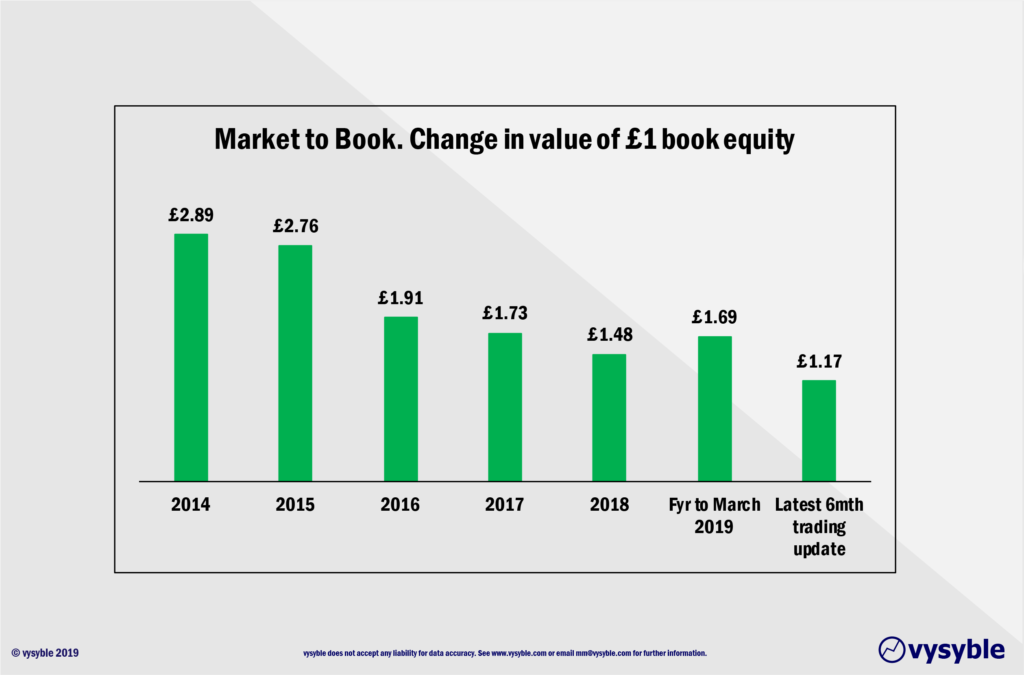
Using the reported equity base as per the most recently released balance sheet, £1 of book equity is worth £1.17 at the end of August 2019 – 31% down from the position at the end of March 2019 of £1.69. One might conclude that the capital markets are not expressing their unbridled enthusiasm for the current strategy by acquiring M&S equity capital.
Archie Norman was appointed as M&S Chairman in September 2017. He is undoubtedly an industry “big hitter” with an enviable and successful track record of corporate turnarounds. In reading the 2019 Annual Report, there can be little doubt that there is an awareness of the need to change the business and move it forward. In our experience, “the fish rots from the head” so the renewed focus from the Chairman is encouraging.
However, as we have seen with Tesco (and is no doubt prevalent in other retail businesses), seeing the need for change and implementing it effectively are not always natural bedfellows. The Board and the management team will need to:
- Re-focus the objective of the business in driving returns to shareholders; as well as considering a broader range of stakeholders
- Understand more clearly what drives their share price on the capital markets
- Have better visibility of the where’s and why’s of value creation and destruction in and across their businesses
- Adopt a strategy process that works effectively
- Align management reward more closely with driving returns to shareholders
- Make large investments in developing senior managers to demonstrate sufficient “skill and will” to manage the value in the business.
Easy to say and difficult to do. We do hope that the business is successful.
vysyble