
20th November 2018
The Premier League continues to accumulate revenue records with almost monotonous regularity. However, is there a direct link between the wealth of clubs and on-pitch performance? Our work suggests that the relationship between money and playing performance is more complex than a simple linear proposition.
For example, the top 6 clubs by revenue i.e. Arsenal, Chelsea, Liverpool, Manchester City, Manchester United and Tottenham Hotspur, despite producing positive “profit before tax” numbers, have not achieved a collective economic profit since 2009. Chelsea and Manchester City are collectively responsible for £1.3bn of the £1.9bn of economic losses accumulated in the division since 2009.

The notion that the Premier League, with its current economics, is the modern equivalent of the “Gold Rush” is quite simply wrong. The record shows that over a period of 9 years, owners have given their wealth to other stakeholders to the tune of £1.9bn, predominantly to players and their agents. This is despite a rate of revenue growth that most other industries can only dream of.
By developing the Economic Profit concept further, we believe that valuable and more detailed financial insights can be uncovered by benchmarking all the clubs using a single index. Accordingly, we developed the vysyble Football Profitability Index® (FPI) which measures the economic efficiency of each club based on the simple relationship between revenue generated and economic profit. In other words, how much revenue is actually translated into an economic surplus?
It is expressed as EP/R ®.
For instance, an FPI value of 100 represents a break-even position i.e. £0 economic profit/loss per £100 of revenue. An FPI value of 95 represents an economic loss of £5 per £100 of revenue i.e. 95-100. An FPI value of 105 represents an economic profit of £5 per £100 of revenue ie 105-100.
The index reveals some very interesting features about the inherent dynamics within the Premier League particularly when it comes to the business of relegation. The following table shows each of the three clubs at the bottom of the Premier League from 2009 to 2017 with their FPI values and FPI ranking within the Premier League division.
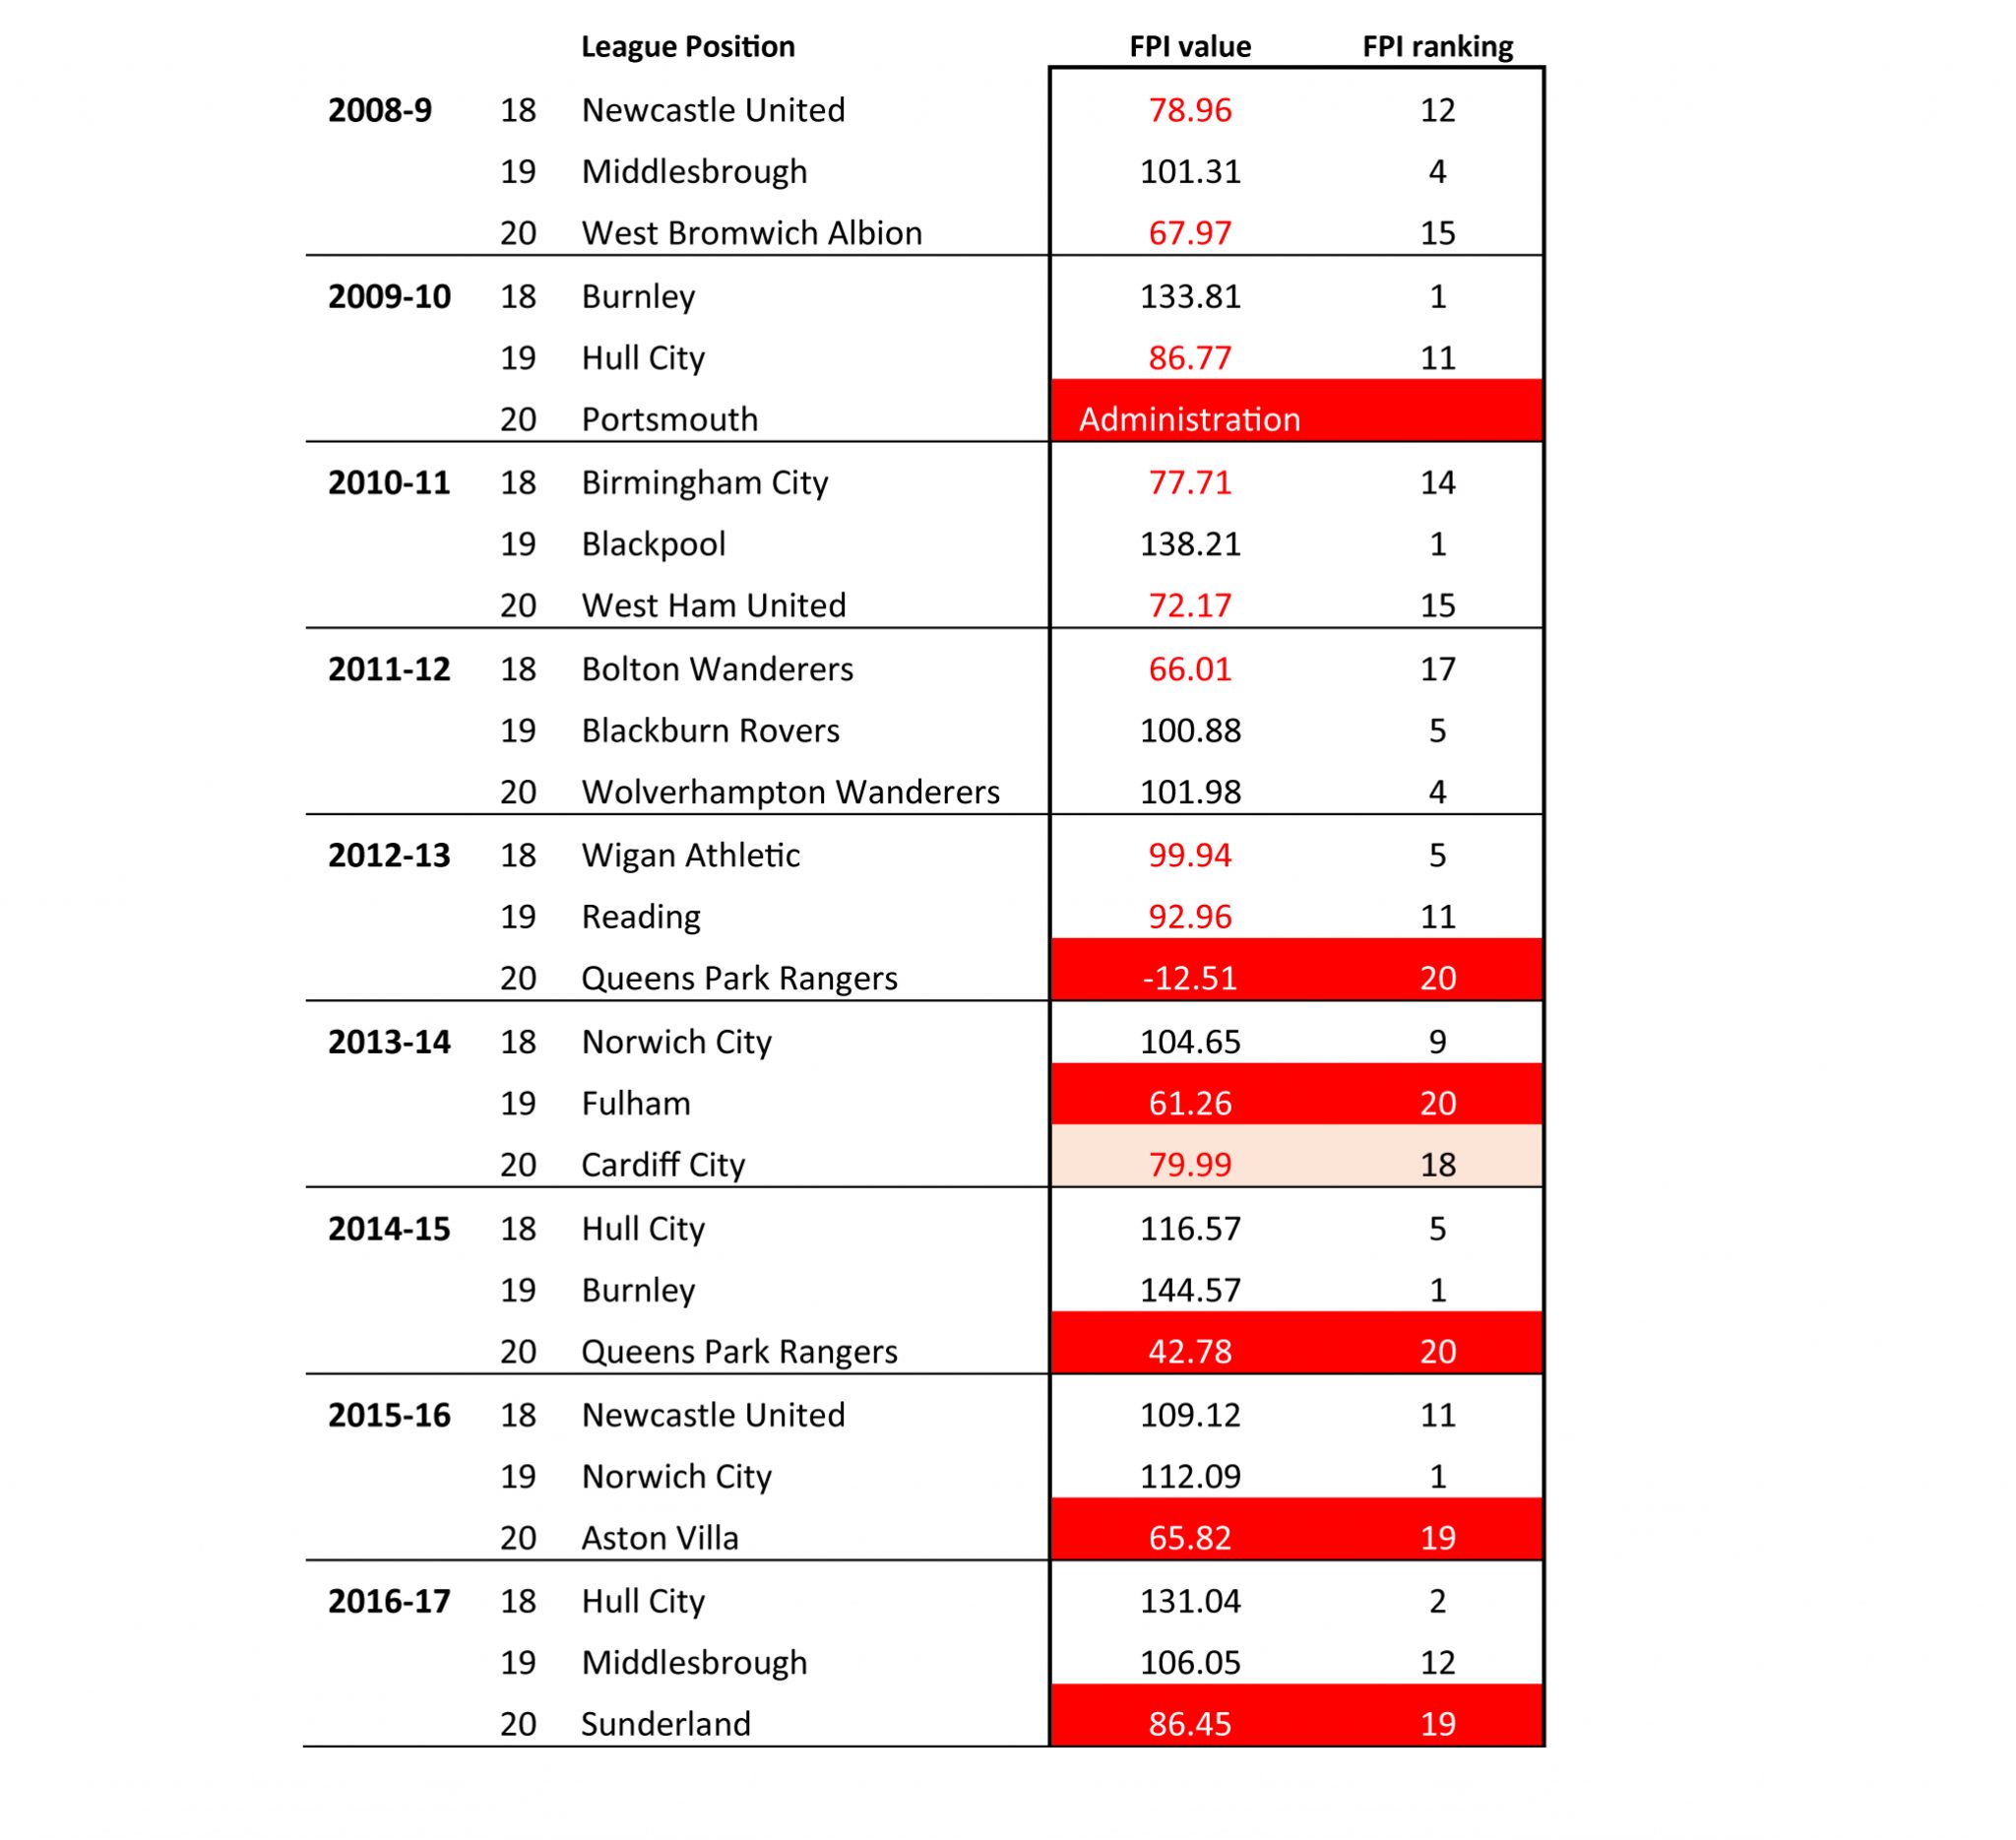
If the top 6 clubs by revenue are excluded from the analysis, then we see that the lowest-ranking clubs by FPI value – and therefore the most economically inefficient clubs – have been relegated every season for the last five seasons when accounts have been available. As a matter of interest, the clubs that were ranked by FPI value in 19th position in 2016 and 20th position in 2017 were Chelsea and Manchester City respectively.
An alternative view is to take the same table but to highlight the most economically efficient clubs in the division.

When viewed through this lens, in four of the last nine seasons the most economically efficient club has been relegated.
Surely something is amiss?
We do not think so. In fact, we think that there are a number of factors at play here.
As we have already mentioned and despite impressive revenue growth, the Premier League is economically-challenged primarily, but not exclusively, to Chelsea and Manchester City; two clubs which have in effect warped football’s financial fabric in a similar manner to that of a black hole warping time and space. In the desire to remain competitive and attract the “best” players, other clubs have been sucked into the gravitational pull of ever-increasing player wages which in turn raises costs. The dynamic derives its energy source principally from the increasing TV revenues.
The relegated clubs with low index values e.g. QPR, Aston Villa, Sunderland etc have over-extended themselves and in effect taken on commitments way beyond their economic capacity in a “dash for growth” that has unfortunately failed with damning consequences. Getting too close to the financial “black hole” can have very serious consequences.
The opposite position is aptly illustrated by those clubs that have chosen to preserve their financial sanity over and above any notion of staying in the Premier League ‘at all costs’. Whilst the lucrative revenues of the Premier League has clouded rational thought on occasion, the preservation of the balance sheet for certain clubs is paramount, regardless of performance on the pitch. In this regard, the business strategy is both sensible and pragmatic and accommodates a longer-term view in that the ability to return and fight another day prevails.
Indeed, the combination of relegation with a healthy balance sheet provides for an increasingly quicker return back to the top flight when compared with clubs with damaged and battered balance sheets, as Burnley FC has ably demonstrated on three occasions since 2009.
Given the index output, is it possible to predict the relegation candidates of the future? The very nature of reporting accounts means that the ‘view’ is almost out of date as soon as it is published as there is usually a 6-9 month period after the accounting year-end before the numbers are released to the public.
Occasionally there are pointers. For example, there is an inevitable decline in economic performance over time once clubs have experienced a first season in the Premier League following promotion and the accompanying wall of revenue money when compared to Championship-level earnings. However, with one-third of promoted clubs experiencing relegation during that first season, the financial fillip of promotion can be relatively short.
Over longer periods of time, clubs eventually fall into a phase that we term ‘economic exhaustion’ whereby the annual FPI value either consistently falls albeit with small increments or sits on the breakeven line until the club simply does not have the economic means to compete and is subsequently relegated.
Stoke City’s recently released 2017-18 accounts display all the hallmarks of a club that has fallen into this trap with a marginally positive (ie above 100) FPI performance from 2013 up to 2016-17 before sharply dropping in 2017-18 with an FPI value of 72.49. The club was thus operating at a much higher level of economic inefficiency than big-spending Manchester City (FPI value 89.30) during its relegation season.
It would seem that the club’s undoing was a combination of rising wages and a drop in revenue which realised an economic loss of £35m despite 2017-18 being the second year of the usual three-year domestic TV cycle.
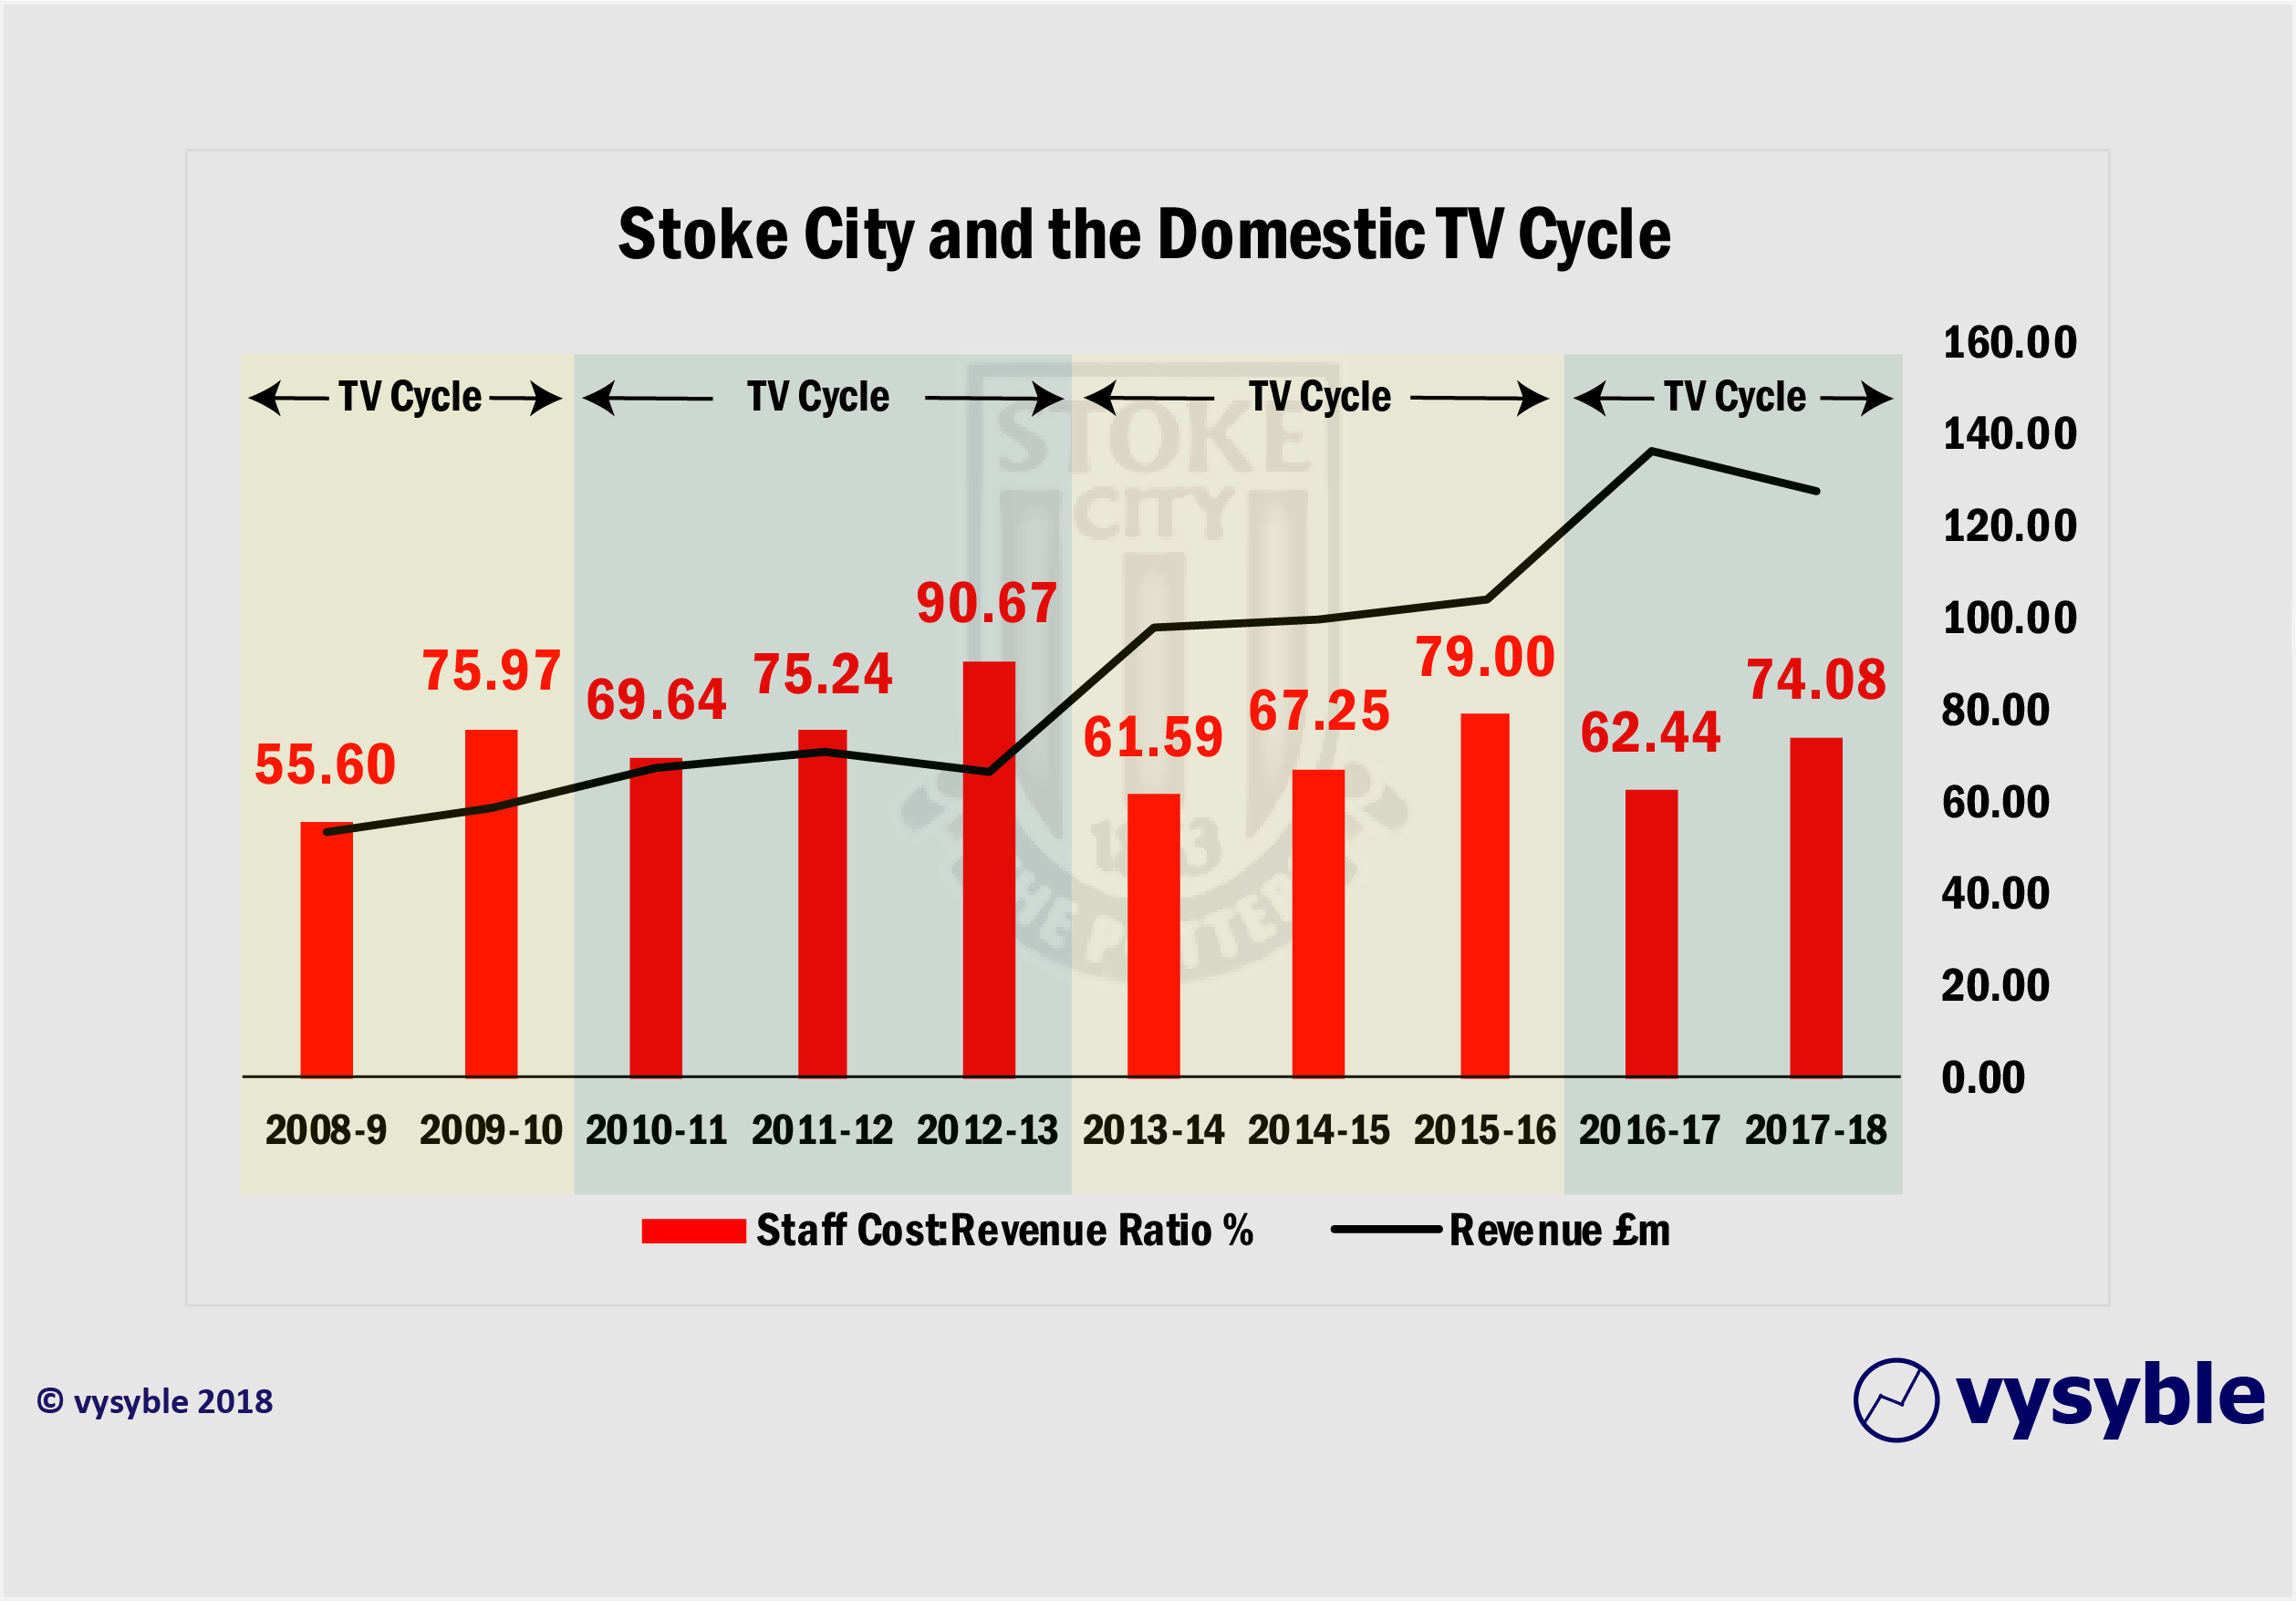
Whether or not Stoke City has the dubious honour of the lowest FPI value in the Premier League for 2017-18 remains to be seen, but it is the lowest value achieved by a non-top 6 club since Aston Villa’s 65.82 in 2015-16. Nevertheless, Stoke City shows that the relationship between poor economic performance and relegation is maintained.
Conversely, the proposition that the top performing club in economic profit terms is a candidate for relegation is much more problematical and less consistent.
Overall, whilst it might seem obvious that poor financial management leads to poor on-pitch performance, the continued and widespread use of the revenue number as a measure of financial performance provides for a wholly misleading view. The desire to maintain Premier League status and thus revenues has driven a number of clubs beyond the margins of financial safety and without consideration for the overall financial wellbeing of the club.
Nevertheless, the Football Profitability Index has shown that what matters off the pitch can be just as important as what matters on it. With that in mind, it may be that the most important position in a football club is not the manager/coach but the Finance Director.
vysyble