
16th November 2020
Manchester United
Introduction
Since we began our work back in 2016, we have become increasingly concerned at the deteriorating economics of the beautiful game. Despite its deeply pernicious consequences across all aspects of society, Covid-19 is not, as some would have you believe, the cause of football’s current financial crisis but merely an accelerant – not unlike adding further fuel to an already lit barbecue.
It is also perhaps easy to forget that Manchester United is quoted on the New York Stock Exchange and accordingly releases quarterly information detailing its financial position. In fact, the first quarter numbers for what will be the year ending on 30 June 2021 were released on Thursday 12th November. As such, it gives an opportunity to determine:
- How the economics of the club are being affected by the pandemic?
- Whether, given the results, there is an opportunity to establish wider conclusions regarding the economic health of the Premier League?
Initial overview
At a headline level, we are able to observe Manchester United’s progression from a position of relative operational normality into the disrupted environment caused by the Covid-19 virus from March 2020 to the end of September 2020. A period covering three financial quarters of data i.e. Q3 2020, Q4 2020 and Q1 2021.
As you may recall, football stopped on 13th March 2020 with the season’s restart commencing on 17th June 2020. Therefore, the final weeks of the month of March form the tail-end the third quarter of the 2020 fiscal year which, in Manchester United’s case, runs from 1st January 2020 to 31st March 2020.
In previous years, Manchester United’s financial profile has been one of increasing revenues and increasing economic losses. By way of a reminder, the economic profit/loss metric considers all capital charges incurred by the business including the cost of equity capital plus all taxation. It is a more rigorous measure of financial performance than those promoted by the club in its quarterly and annual reports e.g. the rather questionable (adjusted) EBITDA, EPS etc.
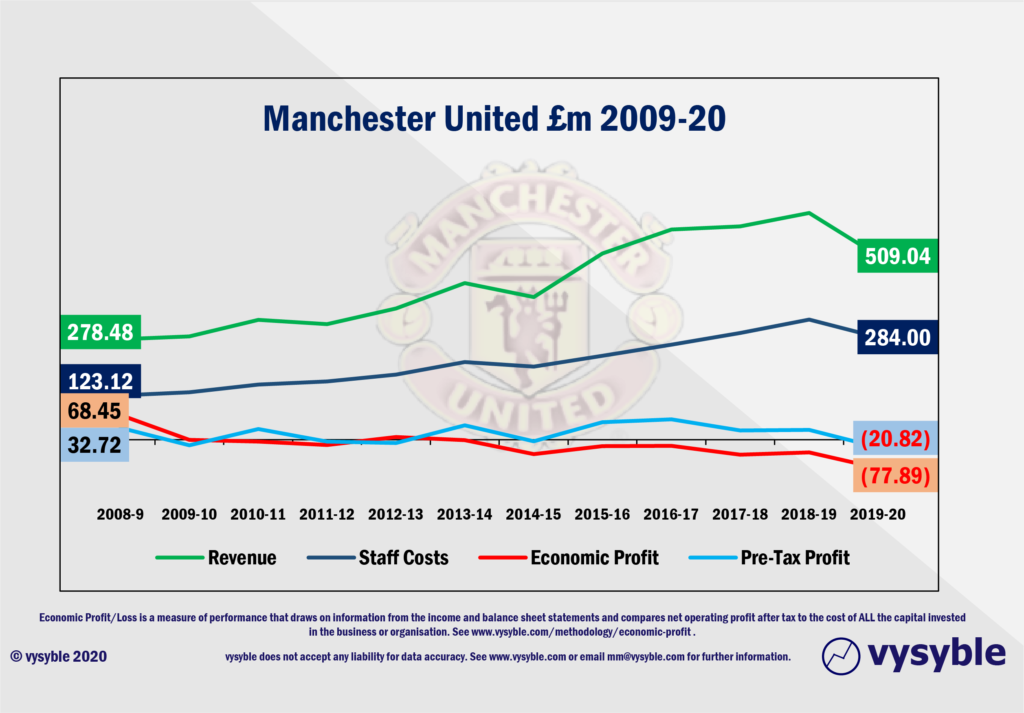
It is also worth highlighting that the club was involved in Europa League football rather than the more lucrative Champions League in 2019-20 as it was in 2014-15. Despite this, the effects of Covid-19 towards the end of the 2019-20 season and into the start of 2020-21 have been significant as we will now explain.
Quarterly Revenue
The quarterly revenue profile shows a significant fall in performance from Q2 2020 onwards which in itself is part of a larger downward quarterly trend since Q2 2019.
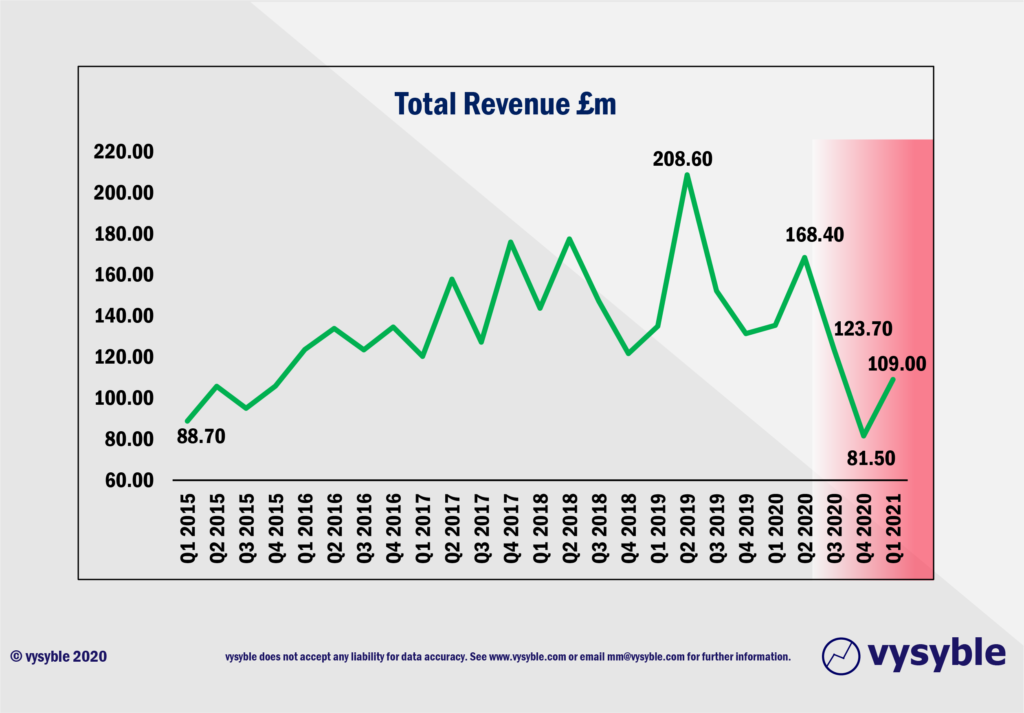
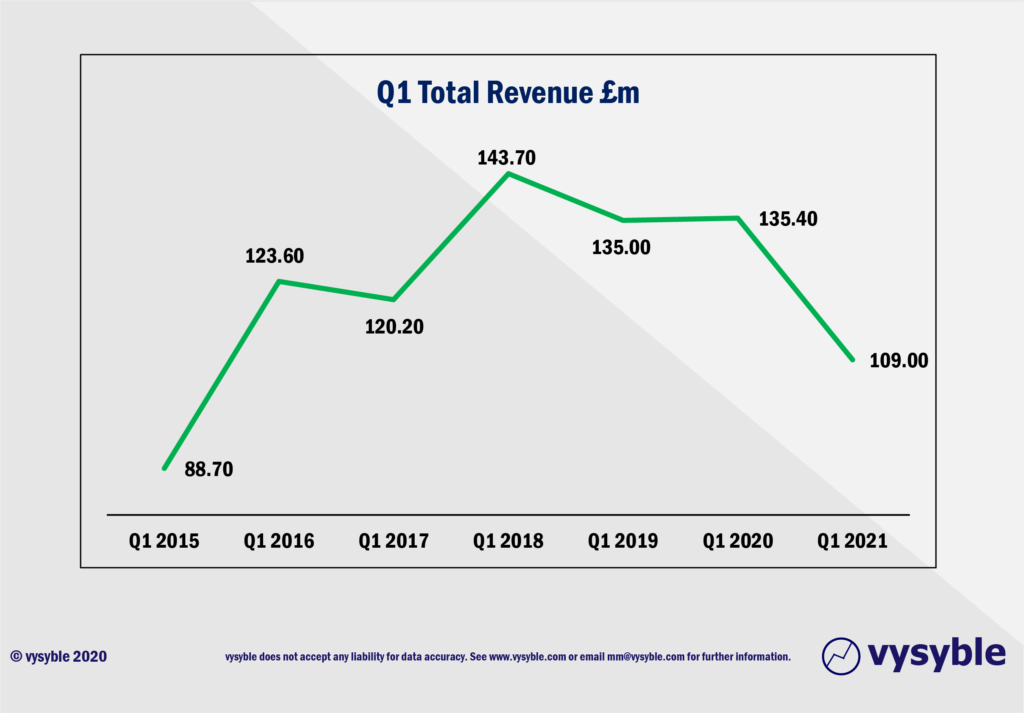
Quarter-on quarter comparisons reveal that the revenue total for Q1 2021 at £109.0m is the lowest first quarter balance since Q1 2015, which was a Europa League season. In 2020-21, the club is participating in the Champions League so the difference in Q1 year-on-year revenue can be squarely aimed at the virus.
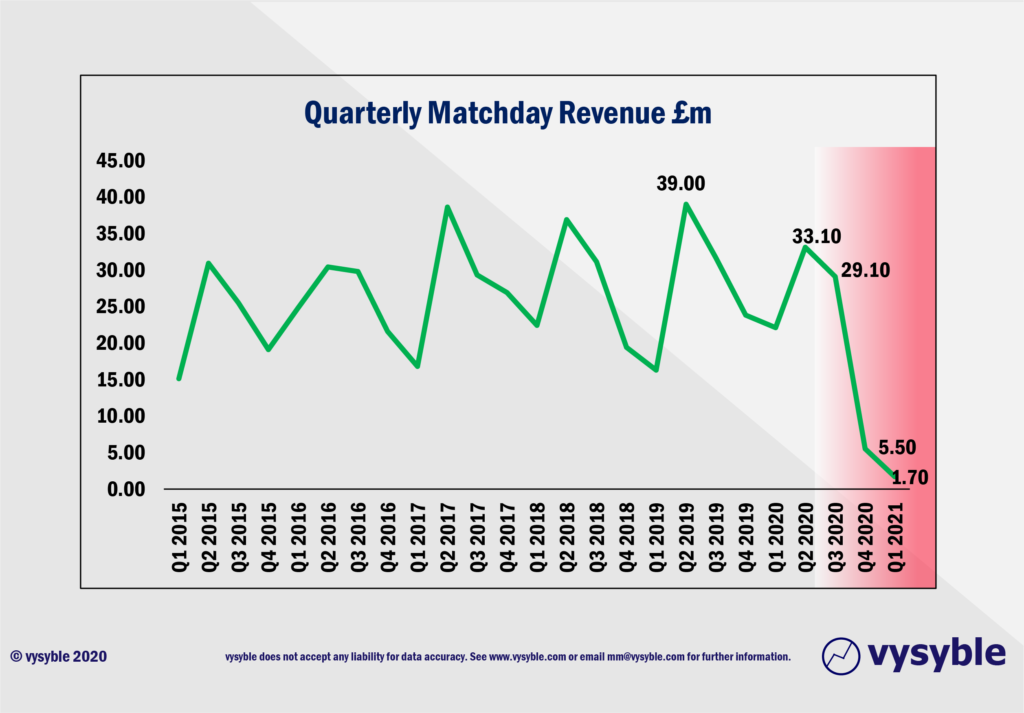
Breaking down the revenue numbers into their constituent categories ie Broadcast, Commercial and Matchday, highlights more specific areas of concern. As expected, Matchday revenues have been decimated due to the ongoing ban on crowd attendance.
Broadcast and Commercial revenue have also been affected;
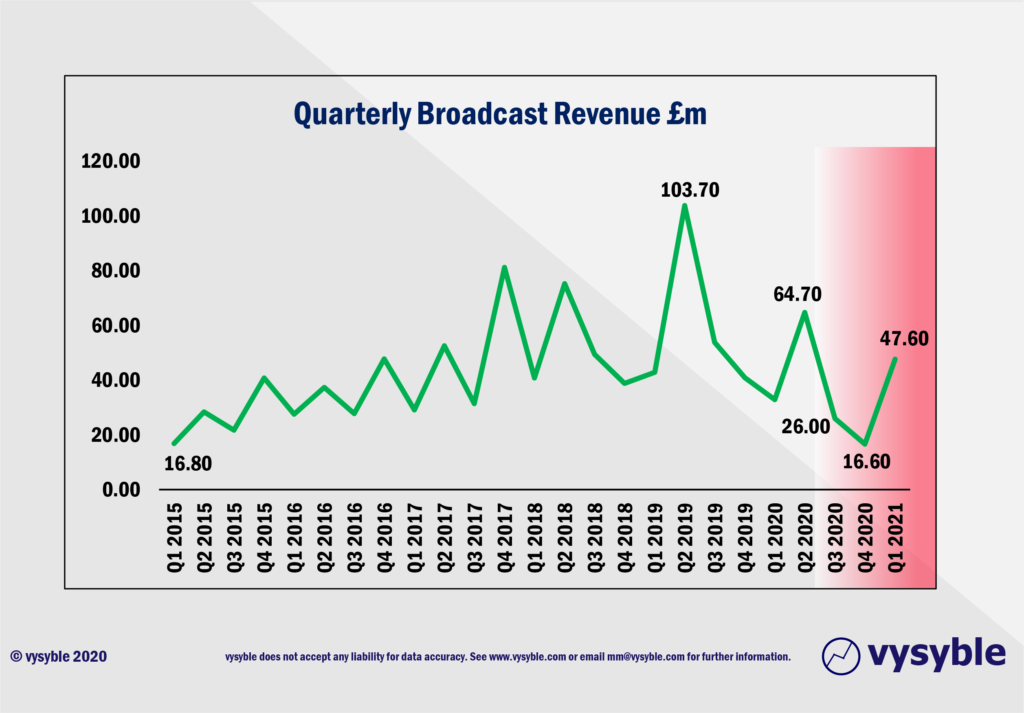
The Q4 2020 Broadcast value of £16.60m has not been seen since Q1 2015. More worryingly, the combination of Europa League football and the effect of Covid-19 has resulted in a significant downward trend in quarterly Broadcast revenue values since Q2 2019.
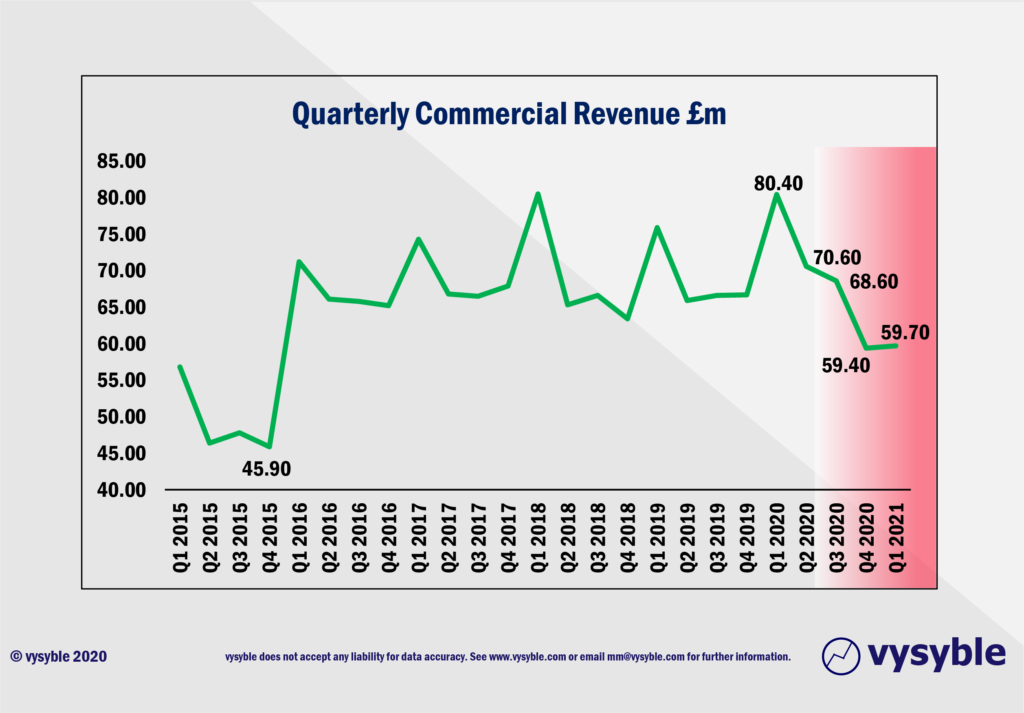
Equally, the quarterly values for Commercial revenue have declined to levels not seen since Q1 2015. Indeed, the striking aspect in this regard is that annual Commercial revenue between 2016-20 has grown overall by just 4% or £10.78m. Nevertheless, Covid-19 has imposed a regime of deferred sponsor payments as described in the official accounts and extensions to key sponsor contracts eg Chevrolet.
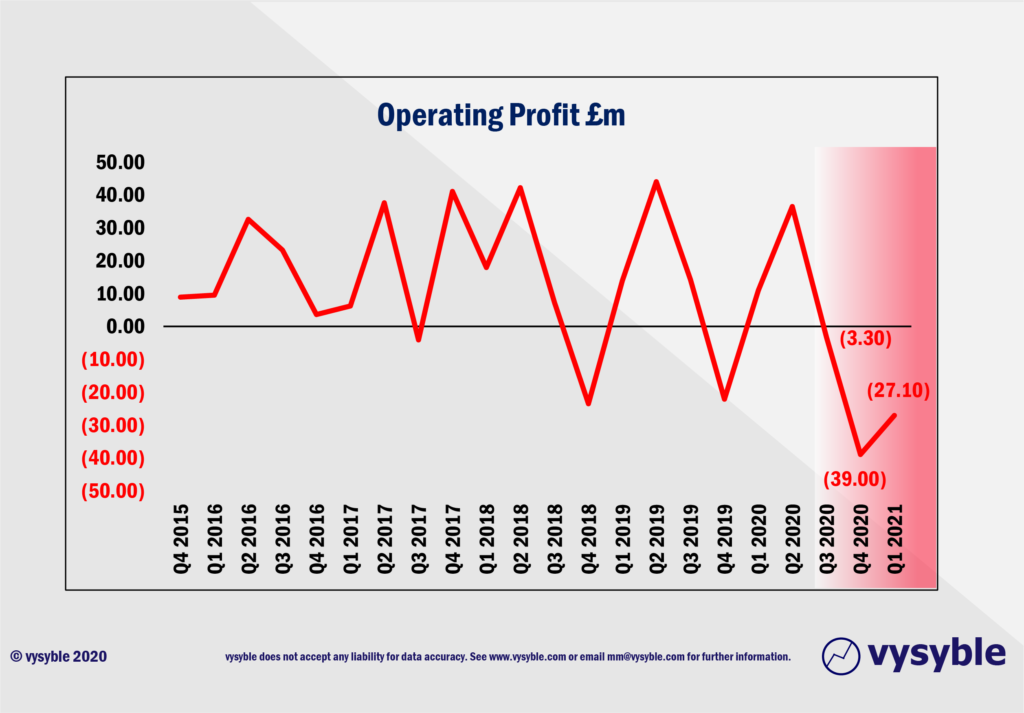
Operating Profit
From an operating profit standpoint, the club has nose-dived into 3 successive quarters of operating losses totalling some £69.40m. Indeed, five of the last ten published quarters have now resulted in operating losses, whereas the previous ten quarters returned just one operating loss. Even when viewed through a conventional accounting lens, one can see that the performance of the club is deteriorating.
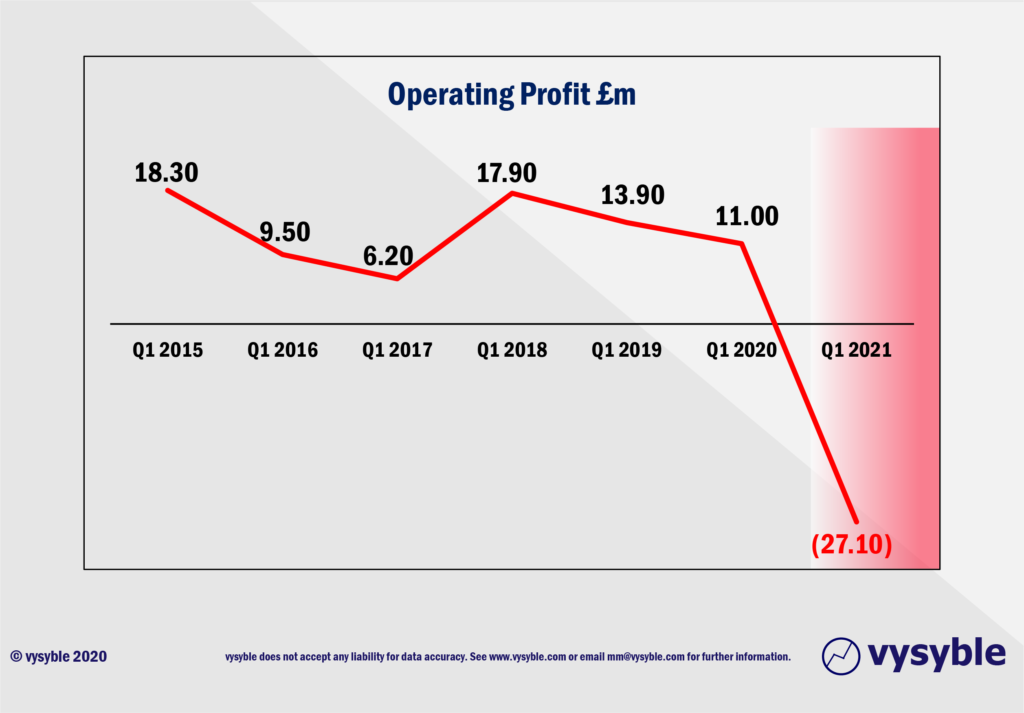
When we review year-on-year quarterly performance, the operating performance of the club is even more worrying. A Q1 2020 operating profit of £11.00m has been transformed into a £27.10m operating loss in Q1 2021 – a downward movement of £38.01m.
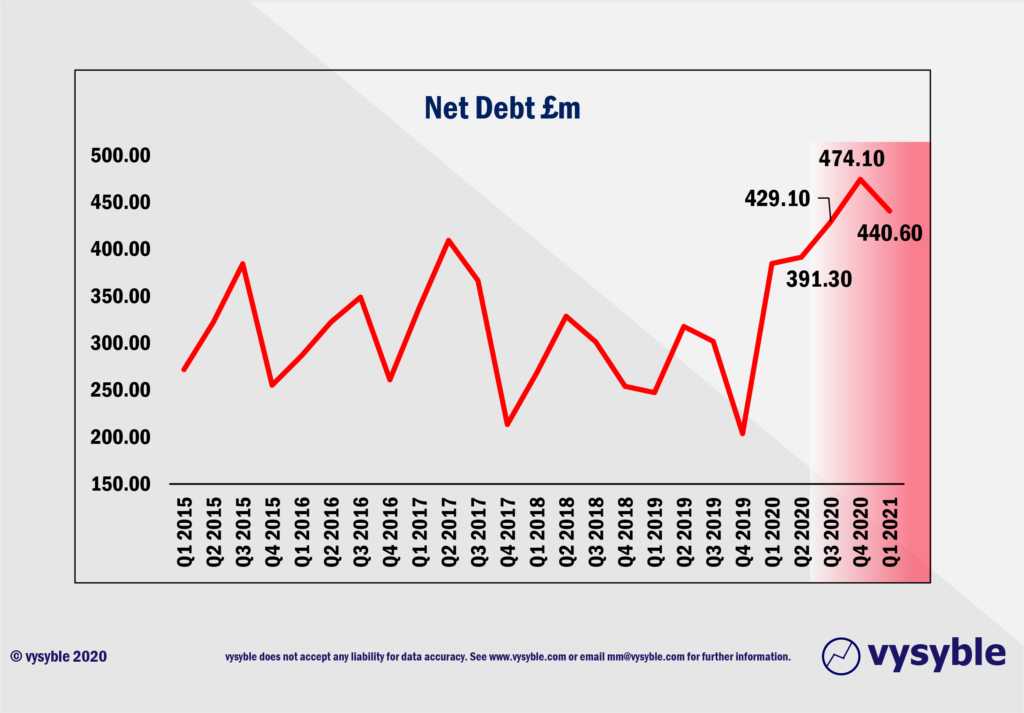
Net Debt
One of the consequences of the erosion of revenue over the last three quarters is the increase in net debt. This has now surpassed the £400m level for the last three quarters following a trend of marginal overall net debt reduction since Q1 2015.
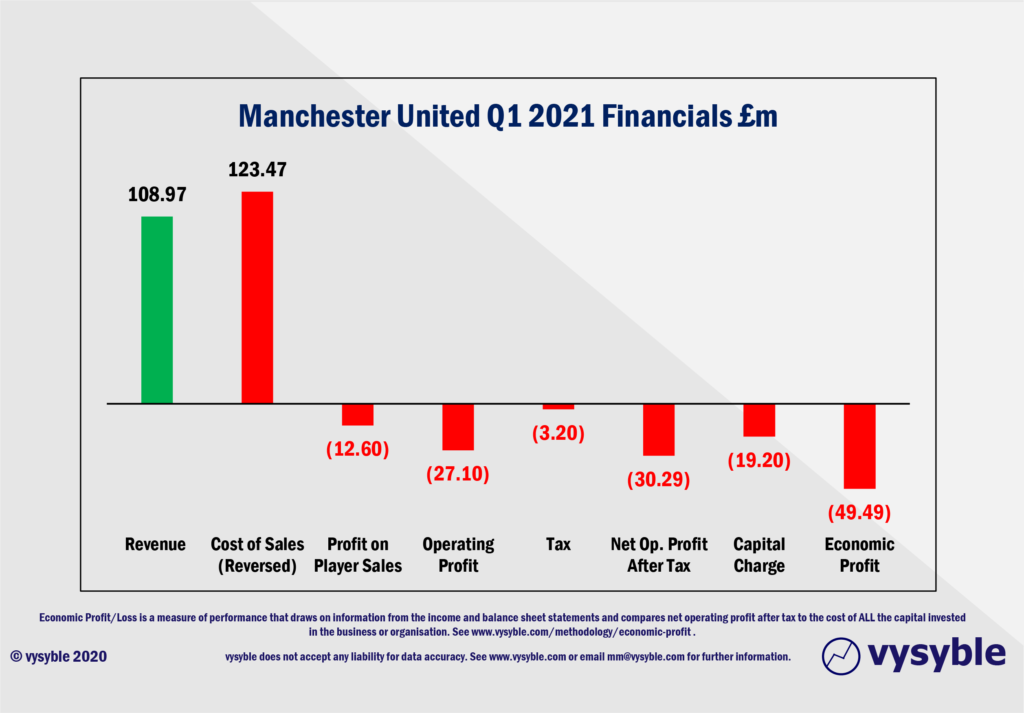
The Economic Position
Where does this leave the club in terms of its economic performance i.e. when all the costs of doing business are included?
Q1 2021 has realised an economic loss of £49.49m. A breakdown of the values involved is illustrated below:
Once all charges are considered, the economic loss is significant, especially when compared with previous periods as seen below.
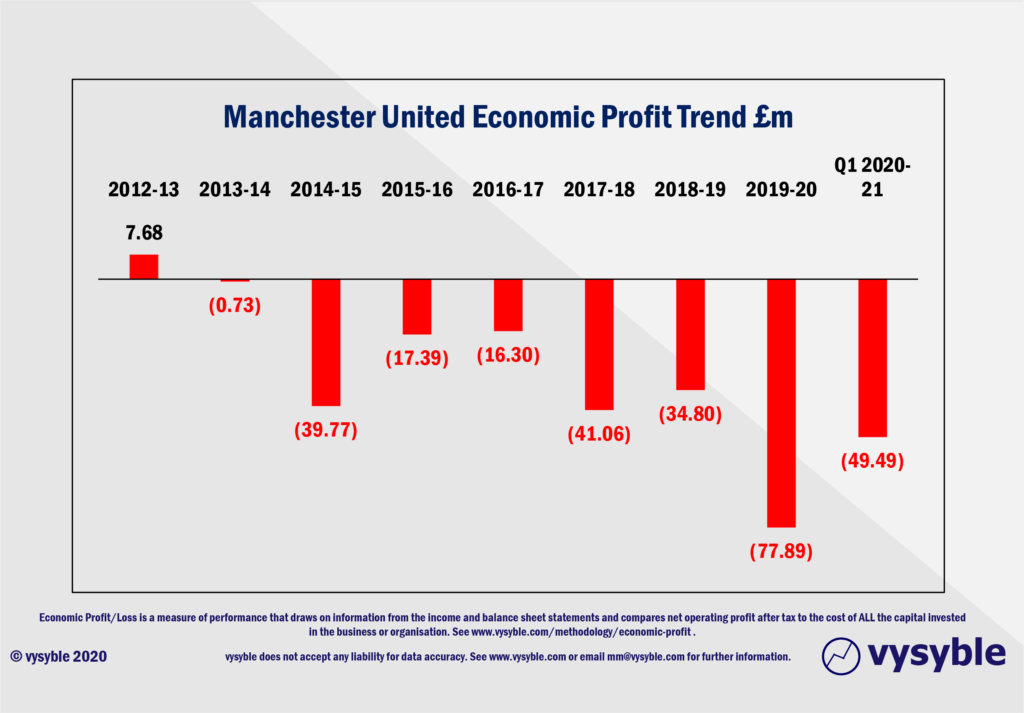
2019-20 would appear to be made worse by the effects of Covid-19 but by how much from an economic profit/loss perspective? If we break out the Economic Profit performance, we can see the effect the virus is having on the club’s finances.
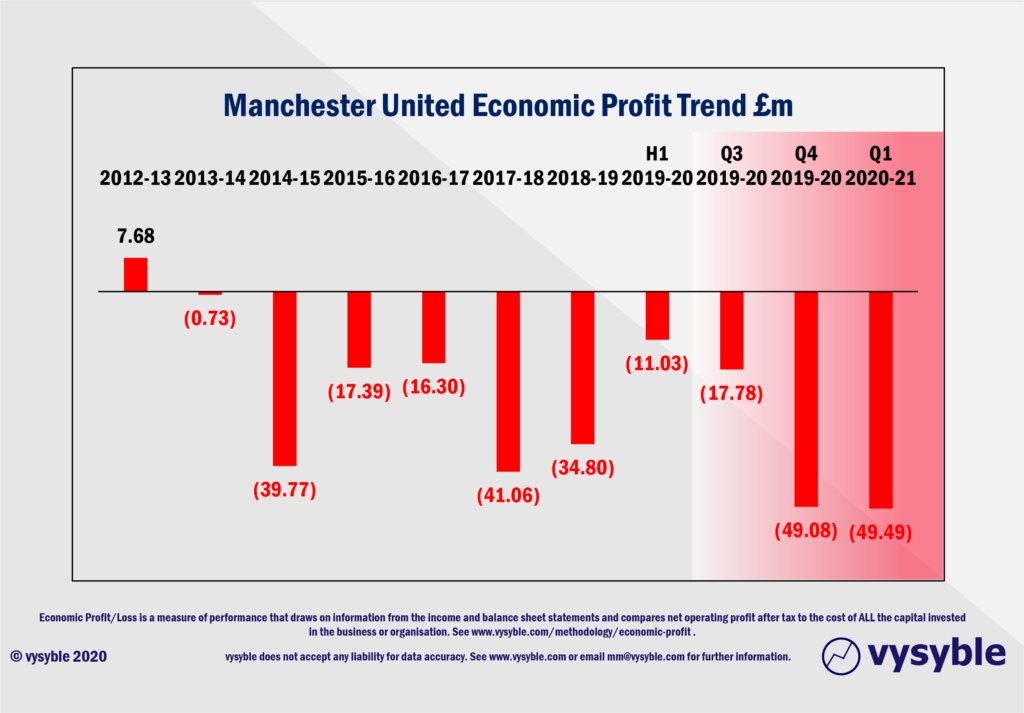
Up to the first half of the 2020 fiscal year i.e. to December 2019, the club had achieved a marginal economic loss of £11.03m from revenues of £303.83m. The vysyble Football Profitability Index which measures the relationship between revenue and economic performance calculates that the club was losing £3.63 per £100 of revenue. This was certainly within normal limits for the club given previous years’ performance.
However, by Q3 2020, things take a turn for the worse with the cessation of football and along with it Matchday revenues and reductions in Broadcast and Commercial revenues. Losses accelerate from £3.63 per £100 of revenue to £14.37 per £100 of revenue. In Q4 2020, the rate of loss per £100 collapses to £60.22 per £100 of revenue, an increase of 1,558% on the pre-Covid-19 rate of loss of £3.63.
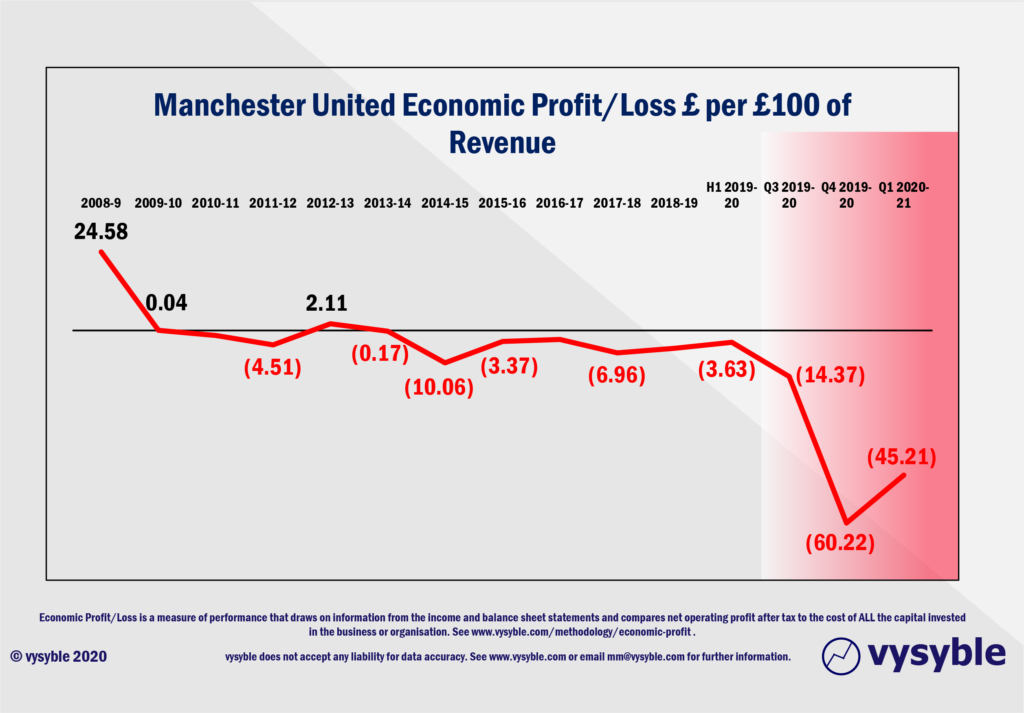
In Q1 2021, the rate of loss improves to £45.21 per £100 of revenue but as the graphic above reveals it remains well below normal operating limits seen in previous years. Notably, revenue for the quarter has improved by £27.50m to £109.00m from the previous quarter’s £81.50m due to the compaction and inclusion of the remaining broadcast games from the 2019-20 season. However, economic losses for the quarter were £49.49m.
The obvious question is what happens if these trends and values apply for the rest of the season. Will the club continue to achieve economic losses of approx. £49m each quarter? If so, this would result in an overall economic loss of around £200m for 2020-21. There are a number of possible scenarios that we can anticipate.
If we take the vysyble Football Profitability Index value for Q1 2021 and apply that to the remaining three quarters of 2020-21, we can work out the revenue required to achieve an economic loss of £200m ie the EP/R calculation. The calculation relies on all costs rising/falling commensurate with revenue ie the EP/R rate remains constant whatever revenue value is applied.
Therefore;
(£45.21) x Revenue = Economic Profit
So, to achieve an Economic Loss of £200m, the annual revenue value for 2020-21 would have to be £442.37m given the constant rate of economic loss per £100 of £45.21.
If the Q1 2021 revenue value of £109.00m is repeated for the remaining three quarters of the year giving a total revenue of £436.00m, the annual economic loss comes to £195.31m.
If the club achieves revenues of £500.00m and the EP/R rate remains at -£45.21 per £100, the economic loss would be £226.05m.
The above approach is indeed a very ‘broad brush’ attempt to give a sense of what might be in the pipeline in terms of overall fiscal performance.
If we take a more considered view of potential events, we can arrive at a more realistic view on where the club might be in a financial sense at the end of 2020-21.
If we assume that crowds are banned up to the end of Q3 2021 ie March 2021 and that a vaccine roll-out program enables the return of limited crowd numbers from April onwards, we can begin to visualise potential revenues as a result.
Normally, Q2 Broadcast numbers tend to increase as Champions League football and a busy fixture list prevail. We do not see any reason why this should not be the case in Q2 2021 although values will be depressed due to the ongoing situation with rebates. We therefore estimate a value of £70.00m for Q2 2021 dropping to £50.00m for Q3 2021 and £35.00m for Q4 2021. We have not factored in any cup runs.
Commercial income usually runs at a quarterly rate of between £65.0m and £70.00m for the period Q1-Q3 since 2016. We estimate that values will be at the lower end of this range ie £65.00m per quarter.
As for Matchday, we have maintained the £1.70m value per quarter. However, given that it is likely that crowds will be allowed in with social distancing but limited in number, we have applied a value of £11.00m for Q4 2021 which is 50% of the average Q4 Matchday revenue between 2015-2020.
Based on the above, Manchester United’s revenue profile for 2020-21 might look something like this;
| Q1 2021 | Q2 2021 | Q3 2021 | Q4 2021 | Total | |
| Commercial | 59.70 | 65.00 | 65.00 | 65.00 | 254.70 |
| Broadcast | 47.60 | 70.00 | 50.00 | 35.00 | 202.60 |
| Matchday | 1.70 | 1.70 | 1.70 | 11.00 | 16.10 |
| Totals | 109.00 | 136.70 | 116.70 | 111.00 | 473.40 |

From an EP/R and Economic Profit perspective, the calculation runs as follows;
If we apply the EP/R of -£45.21 achieved in Q1 2021 to Q2 and Q3, the implied revenue of £362.40m (ie £109.00m + £136.70m + £116.70m) for Q1-Q3 2021 delivers an economic loss of £163.84m.
As outlined, if a partial return of crowds is allowed in Q4 2021, we expect revenues to be around £111.00m. We would also expect a reduction in economic losses given the more normalised operating environment. Therefore, if we compute our EP/R calculation using a reduced rate of economic loss per £100 of revenue eg £25.00, the economic loss for the quarter based on an assumed revenue of £111.0m is £27.75m.
Adding all of the economic losses together ie Q1+Q2+Q3 2021 = £163.84m plus the economic losses from Q4 2021 of £27.75m realises a potential economic loss of £191.59m from a potential revenue of £473.40m.
There are, of course, plenty of caveats or as a certain US politician once put it, ‘known unknowns’. For example, the club may be successful in selling players in the January 2021 transfer window. This would have a positive impact on operating profits and thus the economic profit/loss performance of the club. However, the summer window of 2020 proved to be exceptionally difficult for Premier League clubs in offloading what is, in effect, excess stock. We also do not know at this time the extent to which Broadcast values have been affected by rebates and contract cancellations. We are also unaware of the contractual conditions for payment on commercial contracts.
Nevertheless, our calculations make one thing noticeably clear. If Manchester United is suffering financially to this extent as a result of Covid-19, then the other 19 clubs must be feeling the same if not more financial pain.
As we have often said, the demand by Government that some Premier League revenues are further redistributed to the lower ranking clubs is hard to visualise given that it is one group of economically loss-making clubs being asked to further fund another group of economically loss-making clubs.
Indeed, the summer transfer window could be the last act of folly as clubs rushed to spend £1.2bn gross on players with their extended lines of credit. As this worked example suggests, many clubs will have incurred their biggest-ever losses when the 2020-21 financial results are released.
And given that the Premier League cohort of 2018-19 achieved economic losses of £599.54m, Manchester United’s potential to achieve economic losses close to £200m in this Covid-19 ravaged season suggests that the 2020-21 Premier League cohort may well be on course for annual record economic losses of over £1bn.
vysyble
Follow vysyble on Twitter
11th November 2020 – A Tight Squeeze – Football’s Elephant in the Room leaving little space for financial relief.
29th October 2020 – Form and Function – Proposals-a-plenty for football’s structural reform.
13th October 2020 – Project Big Profit – Americans come bearing a proposal for football’s structural reform, just as we predicted in 2016.
8th October 2020 – Game Aid – Football is caught in the crossfire of indecision and financial necessity.
24th September 2020 – Crisis? What Crisis? – We look back 12 months at the demise of Thomas Cook and its relevance to more recent events.
11th September 2020 – Distance Learning – New rules and new values as Covid-19 challenges traditional mindsets and misconceptions.
19th August 2020 – Socked! Marks & Spencer’s Shrinking Value – Retail giant is fast becoming a shadow of its former self.
22nd May 2020 – You’re Gonna Need a Bigger Boat – An assessment of the double financial whammy of potential relegation from the Premier League and Covid-19.
30th April 2020 – Home, Alone – Initial indicators from the wider economy point towards economic and financial downsizing in sport.
6th April 2020 – Board Games – Government, football clubs and players adopt separate ‘brace’ positions as Covid-19 crashes the sports economy.
27th March 2020 – Markets, Mayhem and Manchester United – A look at the questions posed by the share prices of publicly listed businesses.
15th March 2020 – When Saturday Goes – Football has come to a halt. We take stock of the game’s position and ponder its return.
10th March 2020 – Futureworld – The potential economic effects of the COVID-19 outbreak.
19th February 2020 – Lemon Law – How Financial Fair Play can give a misleading view of football club finances.
8th February 2020 – Hammered – Our financial perspective on some of the clubs involved in the Premier League relegation battle.
12th December 2019 – The Cost of Chasing Gold– In collaboration with the BBC, we look at the high price being paid by clubs to gain promotion into the Premier League.
7th November 2019 – Where to Next for M&S? – November 2019 results suggests the retailer is losing its way
10th October 2019 – Red Mist – Manchester United’s 2019 FY numbers and the stagnation of England’s biggest revenue-earning club.
7th September 2019 – Not Just A Loss But… – A detailed look at the decline in Marks & Spencer’s fortunes.
29th August 2019 – Telling It Like It Is… – What really happened when we talked to the English Football League.
5th July 2019 – Chopping Board – Knives out for former Tesco chief.
25th May 2019 –Repeat Prescription – Few believed us the first time around regarding football’s financial plight…
19th March 2019 – Stuff and ‘Nonsense’– Why the Economic Profit metric is the most transparent measure of business performance.
13th March 2019 – Financial Fair Play – Guilty as Charged? – Our thoughts on FFP schemes and their key weakness.
18th December 2018 – Long Division – The Post-Ferguson years at Old Trafford have come at the expense of declining economic and on-pitch performance.
20th November 2018 – The Relegation Game – Tales of woe and economic performance at the wrong end of the Premier League table.
9th October 2018 – A Different View – Why fans ought to be acutely aware of football’s financial dynamics.
17th August 2018 – The End of the Beginning – La Liga heads west to conquer new worlds.
9th August 2018 – Reaching for Sky – the sequel – Latest offer price for satellite TV company is good for shareholders, less so for prospective owners.
8th August 2018 – American Dreams – English Premier League economic dynamics and American money – is a Euro Super League the next step?
3rd August 2018 – Mall Administration – Retail Property Co. bonus payouts at odds with increasing shareholder value.
20th April 2018 – Goonernomics Part Deux – The departure of Arsene Wenger…
18th April 2018 – The Price of Everything – Tesco’s latest numbers offer little in value.
12th April 2018 – Say What? – WPP’s very mixed message.
14th February 2018 – In Case of Emergency – Premier League’s UK TV rights auction comes up short.
7th February 2018 – Lost in Transmission – Top Premier League clubs look beyond domestic TV rights.
4th December 2017 – A Billion here, a Billion there… – The Premier League reaches a major milestone, quietly…
25th November 2017 – Getting out of Toon. – Is Mike Ashley pitching the sale price of Newcastle United at the right level?
16th October 2017 – Goonernomics. How the ‘Bank of England’ club falls short of its North London neighbour.
25th September 2017 – Highlights. More record-breaking numbers from the biggest football club in the land, but no economic profit…
23rd September 2017 – Football’s Economic Back Pass. A guest blog for the Soccernomics website.
12th September 2017 – Crystal Balls-up. Changing strategic direction is not a good idea when you haven’t looked at the economics.
27th July 2017 – Football’s Summer of Money and the £65 pint of beer. The sport that just can’t spend enough.
11th July 2017 – Football Special. Observations following the launch of ‘We’re So Rich…’
9th May 2017 – Illuminating, non? Political energy lacks vision and power.
2nd March 2017 – Claudio’s Burden. The price of failure outweighs the price of success.
12th January 2017 – Shopping for Godot. A never-ending quest for value in Retail.
27th December 2016 – Reaching for Sky. Is Rupert Murdoch’s £10.75 per share a fair price?
6th December 2016 – Auld Lang Syne. A reminder from history of the damage that poor financial planning can cause.
1st December 2016 – Fork Handles? Four Candles? Tesco’s blurred strategic vision.
27th November 2016 – Football’s Instant Replay. Financial warning signals for the top English Premier League clubs.