17th March 2023.
It’s that time of the year again when the pace regarding the release of football club annual accounts begins to run that little bit quicker and the financial picture for the previous season starts to emerge. Will there be a continuation of trends that have been embedded for years or will a surprise or two suggest a different financial road ahead for the clubs?
Ten of the 20 Premier League club cohort of 2021-22 have released their accounts and it makes for grim reading. As we correctly predicted, those who thought that a return to ‘normal’ revenue levels would lead to a post-Covid profit bonanza are, based on what we have seen so far, going to be very disappointed.
Yes, the numbers will change as more clubs release their data. Will there be big profits emerging from the remaining group? Unlikely, unless the new fad of loan forgiveness becomes more prevalent (more about that shortly). But people still try to convince us that football’s economics are in good shape. If so, why are we seeing more loan forgiveness?
To date, the 10 2021-22 Premier League clubs have achieved revenues of £3.55bn with staff costs of £2.22bn. Pre-tax losses so far come to £356.71m. However, the economic profit/loss calculation, where we take all invested capital and apply a charge once the net operating profit after tax has been determined, arrives at a loss of £563m. And this is just the half-way point in proceedings.
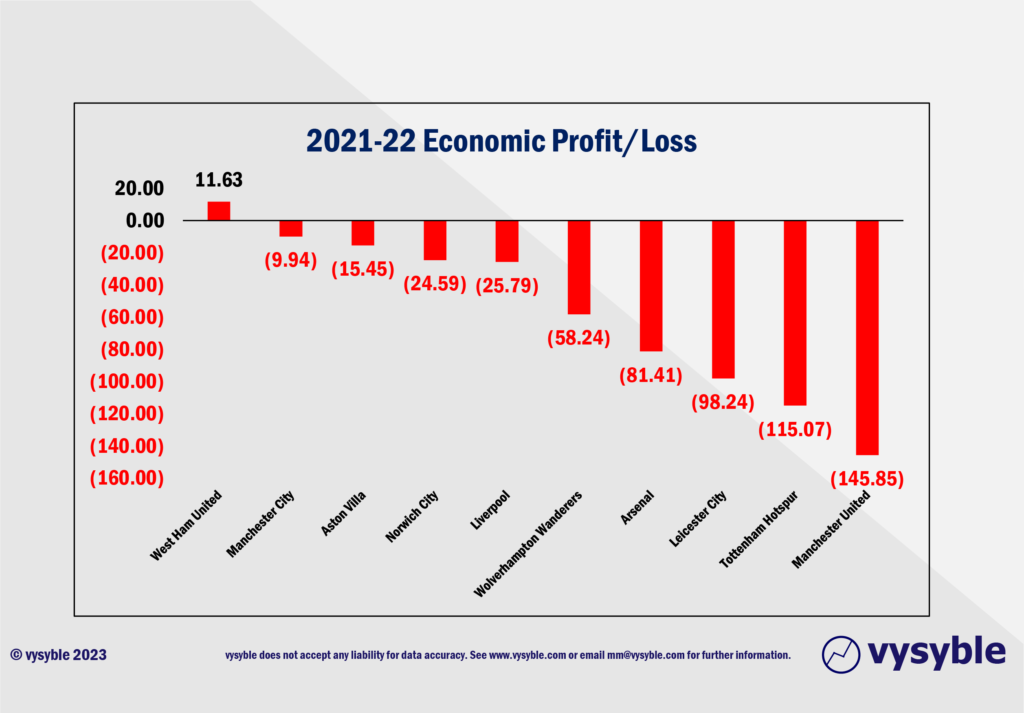
Thus far, our cohort of 10 clubs achieved economic losses of £15.85 for every £100 of revenue during 2021-22. To put this into perspective, the total Premier League club economic losses for the pre-Covid 2018-19 season was £599.54m from revenues of £5.16bn. That’s an economic loss of £11.63 for every £100 of revenue.
| Time Period | Revenue – £m | Economic Loss £m | Econ. Loss per £100 revenue |
| 2021-22 (10 clubs) | £3,550m | (£563.0m) | (£15.85) |
| 2018-19 (20 clubs) | £5,160m | (£599.5m) | (£11.63) |
So, for the 10 clubs that have released their numbers, the divisional loss per £100 of revenue is 36.3% higher than the last full season before the Covid pandemic (2018-19).
The work so far has established the following:
- The 6th biggest annual economic loss of £145.85m (across all clubs since 2008-9), achieved by Manchester United.
- Indeed, the season has contributed two entrants into the list of 17 instances of annual economic losses over £100m, the other being Tottenham Hotspur at £115.07m.
- Just one of the ten clubs has achieved an economic profit; West Ham United with £11.63m. This follows three straight years of economic losses amounting to £124.3m. Budding ‘apprentices’ should take note…
Of course, regular readers will appreciate that the trend of achieving economic losses is not new in itself but the scale of the losses particularly in recent seasons is worrying. There are those who extol the virtues of increasing revenue with bigger and better sponsorship and broadcast deals. However, it matters little if the underlying financial dynamic warrants repeated injections of capital and increased costs to the P&L account to keep the show on the road which appears to be the current position. Even if the effects of Covid are considered, the trend has been one of regular economic losses.
Usually, these capital injections initially take the form of a loan with associated interest charges and is then converted later into equity thus eliminating the interest charge to the profit and loss account. For reasons dating back to the beginning of the 20th Century, the accountancy profession does not believe that equity has a cost. However, we differ from the accountancy profession in that the capital asset model demands and establishes a cost to that equity, hence the increased transparency provided by the economic profit metric. Once this capital cost/charge has been applied, the true picture of financial and economic performance can be determined.
This is why the economic loss numbers tend to be that much bigger, especially if the club owner is issuing additional shares as has been the case at Aston Villa, Newcastle United, Fulham, Tottenham Hotspur etc. The economic profit metric is recognising that equity capital is not free.
However, the new and emerging post-Covid approach would appear to be loan forgiveness/write off whereby the debt is eliminated. For the accountants, it is a debit to the loan account and a one-off credit to the P&L line.
The £194m write off at Leicester City won’t show up until the 2022-23 accounts whereas the Wolves write off of £124m sits happily within the 2020-21 accounts giving the club a pre-tax profit of £144m and an economic profit of £137m.
Nevertheless, this goes to show that the Premier League is indeed ‘a license to print money’ but only when you move it from your left-hand pocket to your right-hand pocket.
Is this an efficient method of managing the longer-term financial health of the club? Set out below is an example from our very own football club, Fictional Athletic FC.
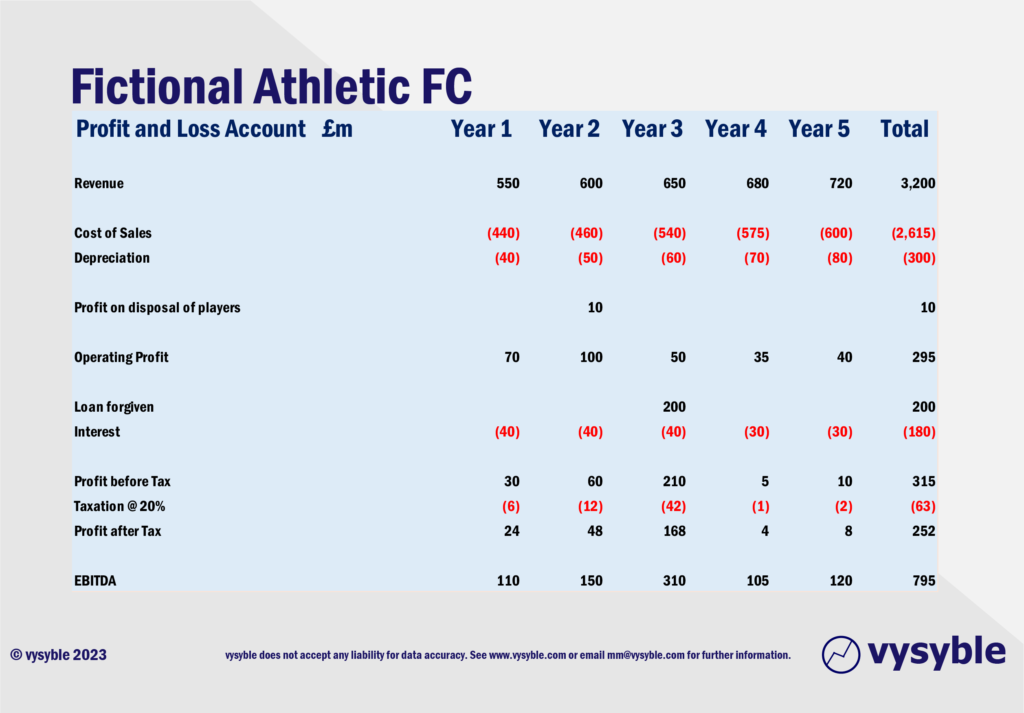
- Over the period, revenue has grown from £550m in year 1 to £720m in year 5, which is an increase of £170m or 31%.
- In year 3, the owner of Fictional Athletic FC decides to forgive/ write off a £200m loan.
- Over the full period of analysis, Fictional Athletic FC produces an accounting profit after tax of £252m which is dominated by the £200m loan forgiveness credit in year 3.
- The interest charge in year 4 is £10m lower than it is in year 3, reflecting the loan forgiven at the end of year 3.
- In this case we assume that debt is costing 5% and the effective tax rate is 20%.
- Equity capital, significantly more expensive than debt, is assumed to cost 12.5%.
- The somewhat questionable EBITDA metric reveals a £795m surplus over the 5 years.
The Balance Sheet perspective is as follows;
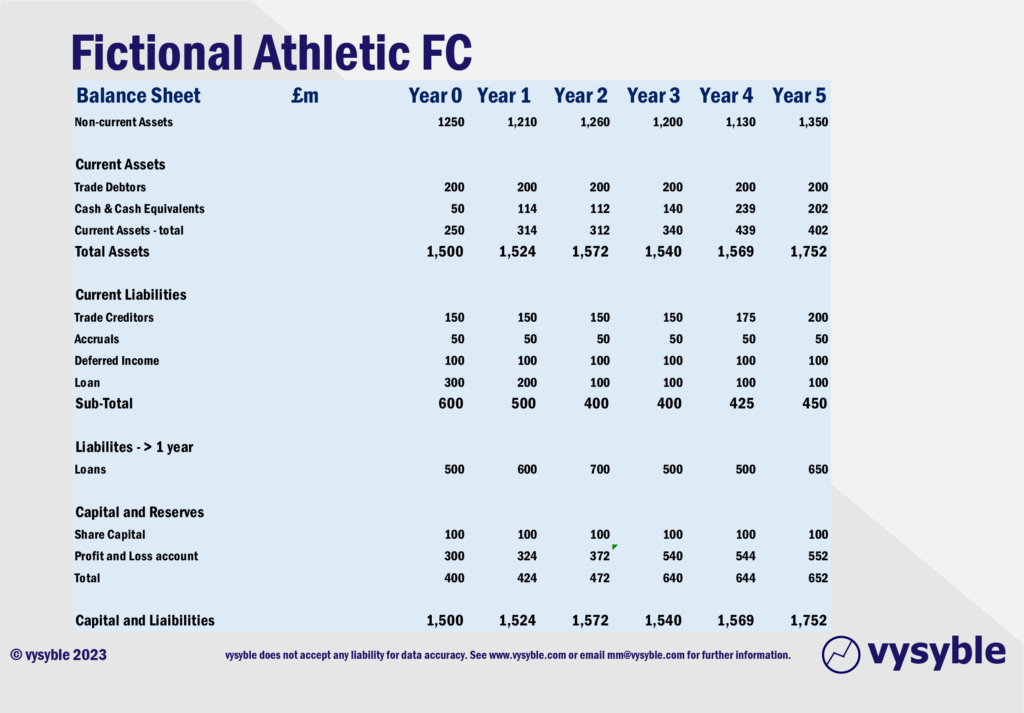
- Non-current assets in this context are primarily the playing squad, which is depreciated annually, and as new players are added. In year 5, there is a £300m acquisition funded equally by a reduction in cash and an increase in long-term (greater than one year) loans.
- At the end of year 3, the owner writes off a £200m loan.
- Equity capital rises from the opening balance sheet (year 0) with a balance of £400m to £652m at the end of year 5.
Overall, the accounting picture shows an organisation broadly generating “wealth”. The situation as indicated with this data would probably prompt the owner and the management team to think the following:
- Overall, the financial performance has been fine.
- £0.8bn of EBITDA has been achieved in the past 5 years.
- Recent years have been more challenging with profit after tax in year 5 just one-third of what it was in year 1.
- Nevertheless, a positive performance all round.
- Nothing to change as business is performing well.
The signal from Economic Profit
Now we will begin the economic profit calculation.
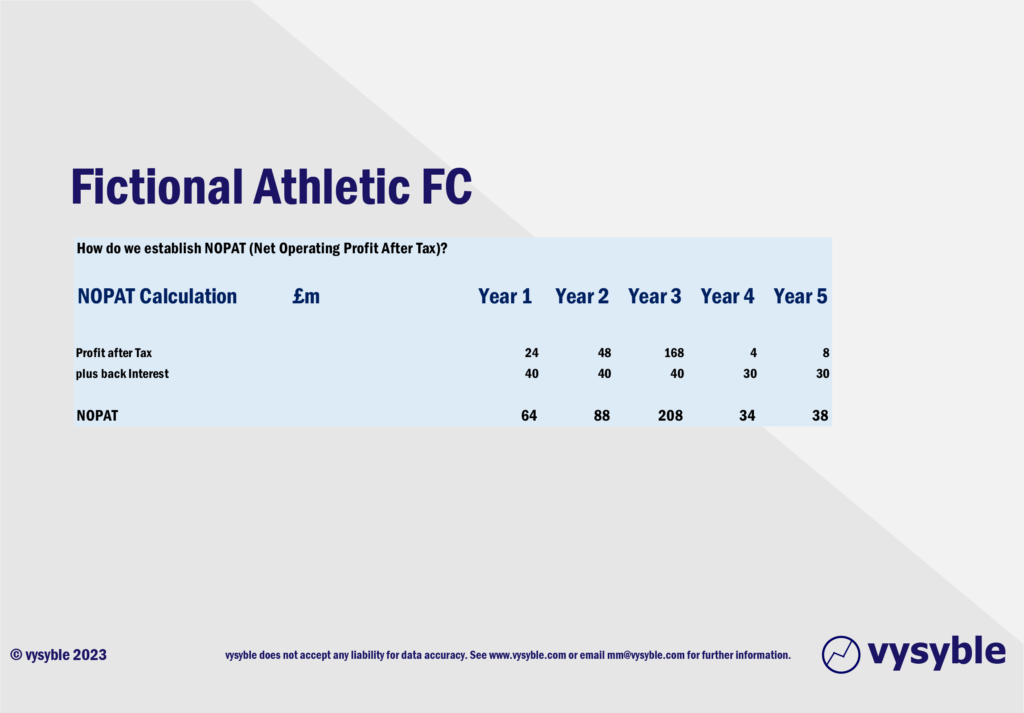
The formula is Net Operating Profit After Tax (NOPAT) less a charge for ALL the capital used by the business.
The first step is to calculate the NOPAT which in this example is very straight forward; we simply add back the interest charge because that will, in effect, be rolled up into the charge for capital. If we did not add back the interest charge, the amount would end up being double-counted.
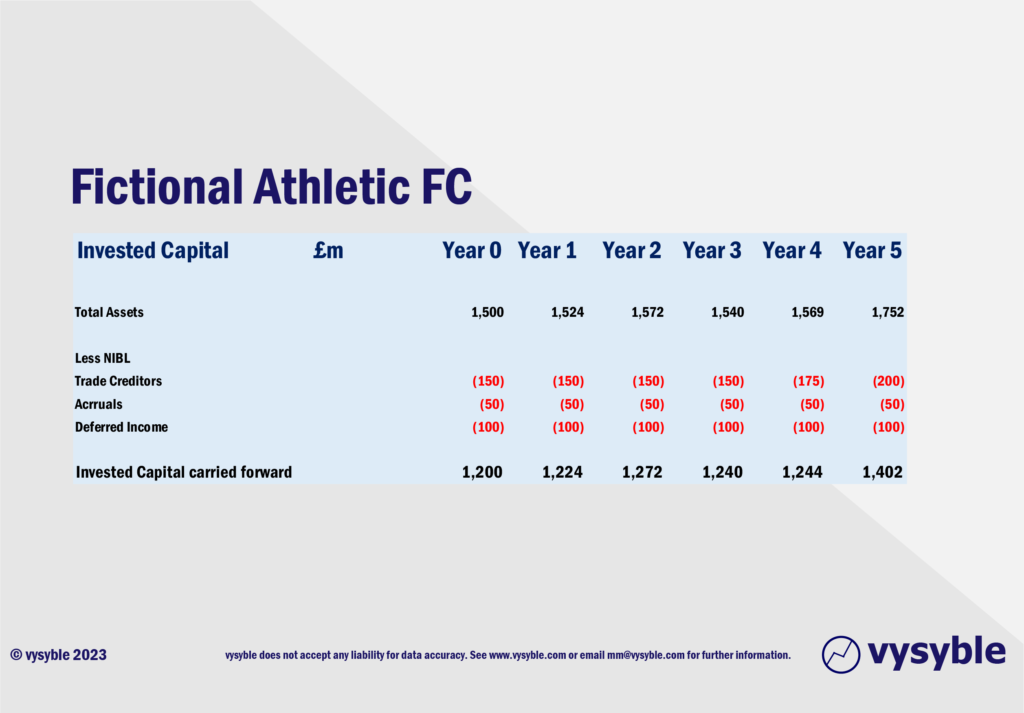
Next, we must establish the charge for capital, which is Invested Capital multiplied by WACC (the Weighted Average Cost of Capital (including the cost of equity capital)). Invested Capital is defined several ways but we use Total Assets less short-term non-interest-bearing liabilities (trade creditors, accruals, and deferred income) which do not really fund the business. The Fictional Athletic FC Invested Capital calculation is set out below:
Following on from the invested capital calculation, we have to calculate the cost of capital – see below:
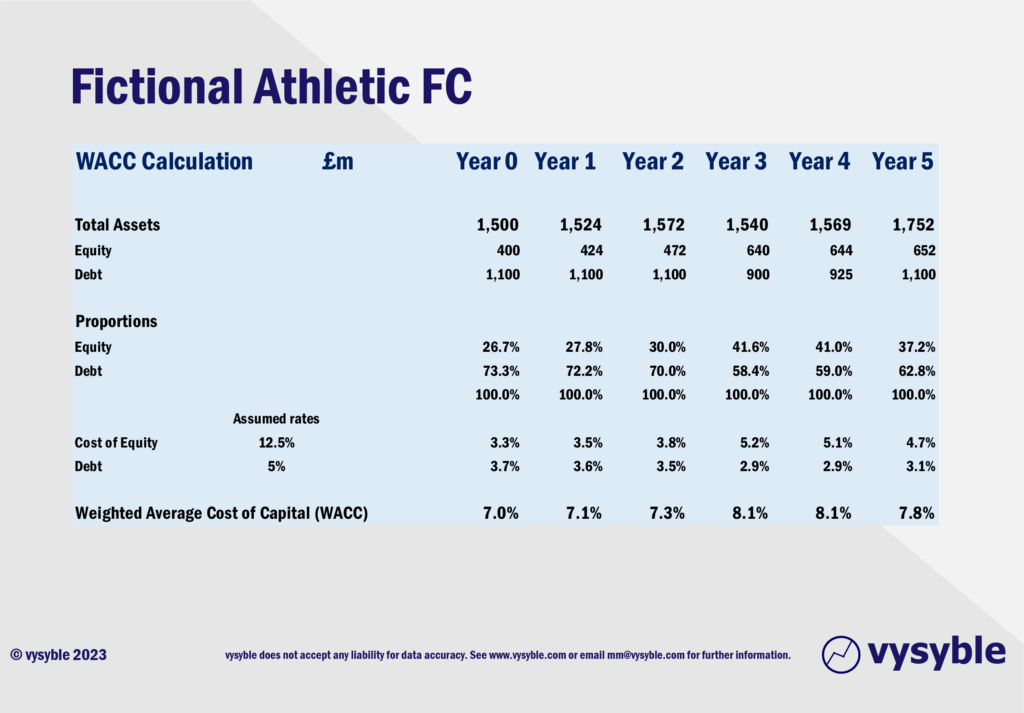
Note how the cost of capital has risen after the loan cancellation/forgiven at the end of year 3. This is reflecting the greater preponderance of equity capital within the overall financing mix. Also, the proportion of Fictional Athletic funded by equity capital rose from 30% in year 3 to 41.6% in year 4.
Normally, equity capital is often significantly more expensive than debt and we note that one or two high-profile commentators who have called for Manchester United to be ‘debt-free’ are, in effect, consigning the club to a higher cost of capital overall than might have been the case with debt and therefore positioning the club with a potential (competitive) disadvantage against other clubs.
Of course, we are NOT suggesting that the club should be financed entirely by debt but there is, in our view, a sensible blend of financial support, perhaps one routed in the economic realities of the club rather than from a simplistic accounting narrative?
The Charge for Capital
Having established the cost of capital, and calculated the quantum of invested capital, we are now in a position to quantify the cost of capital:
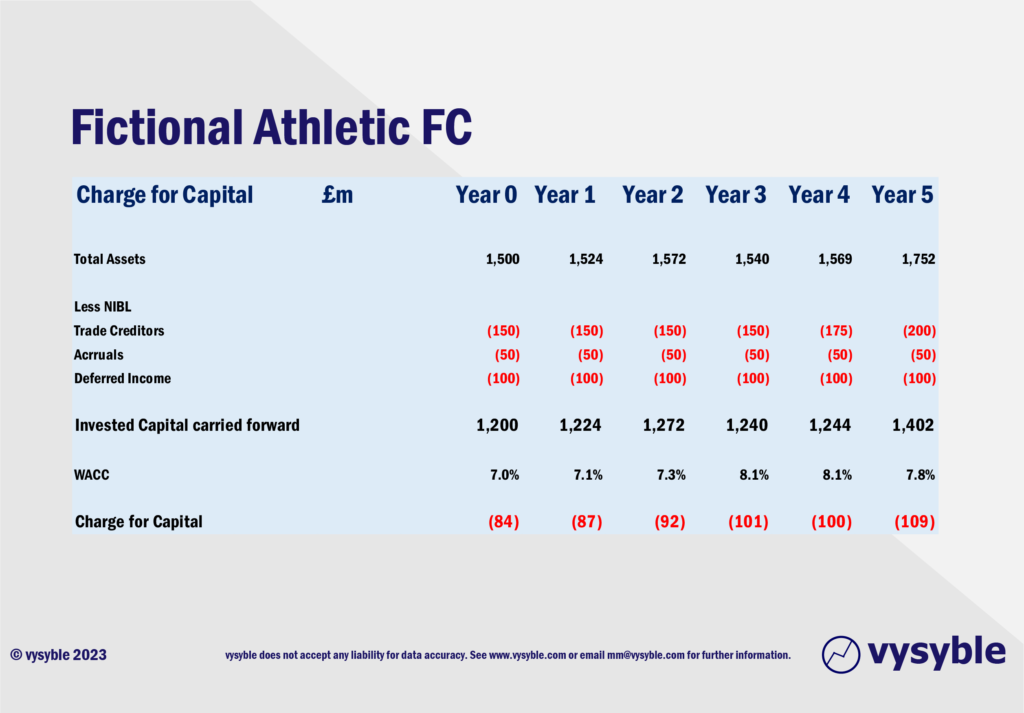
To keep things simple, we take the closing Invested Capital balance from the prior year to calculate the charge for the subsequent year.
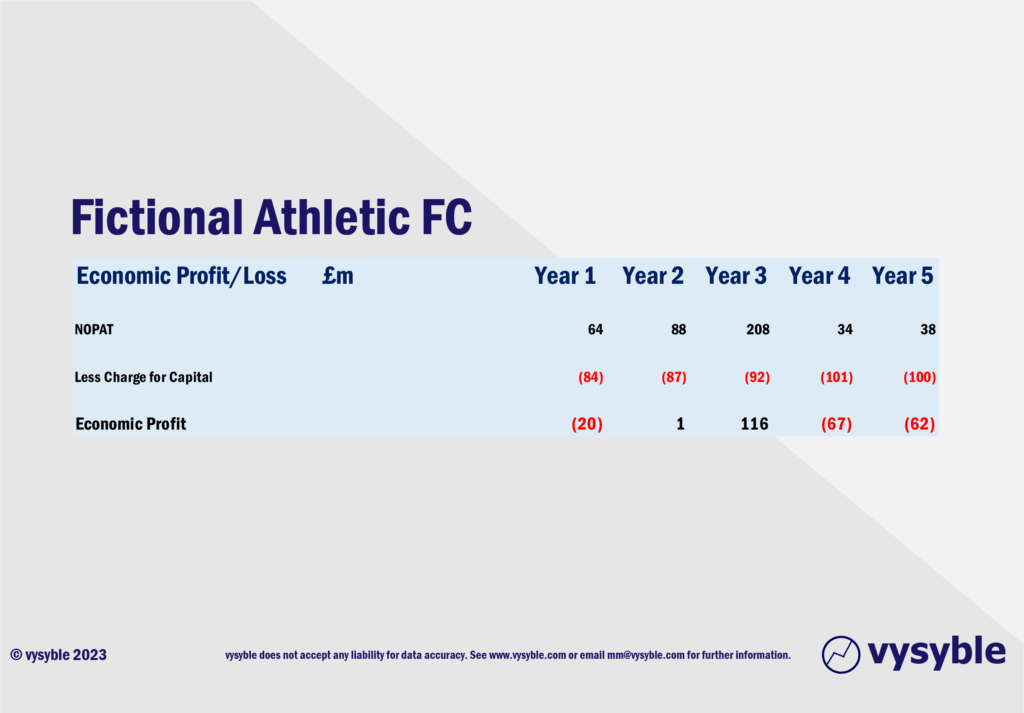
In our 5-year view, Fictional Athletic FC has produced an economic loss of £32m, despite revenues over the five-year period of £3.2bn. Whilst this example is indeed fictional, it is a common economic reality for many Premier League clubs.
However attractive it may seem, debt cancellation may alleviate short-term cash management considerations but it increases the overall cost of capital. Executive Management teams and indeed several academics ought to be aware of this, although our experience would suggest otherwise.
We do find it interesting that whilst some commentators continually promote the notion that the game is ‘awash with money’, it is counter-intuitive to this point that there is a need for loan forgiveness. Both cannot co-exist.
And given the economic performance of our club relative to the more optimistic and incorrect perception provided by the EBITDA metric, the correct signal to the Executive Management team is something along the following:
- Performance has been poor and has deteriorated.
- £32m of value has been destroyed in the last 5 years.
- The loan forgiveness strategy has increased the cost of capital, potentially placing the club at a longer-term competitive disadvantage. A debt-free strategy might strike a chord with characters in a Charles Dickens novel, but it is seldom the value-maximising way forwards.
- The current strategy is not working and cannot be allowed to continue.
Marshall Definition and Valuation
We don’t want to be repetitive but it is contextually important to go back to 1890 and Alfred Marshall’s definition of Value Creation:
“Value is created by investing capital and generating a return greater than the cost of that capital.”
Principles of Economics – Alfred Marshall 1890
Let us be clear, if you accept the above definition, then one must also admit that the picture painted by modern financial accounting practice does not meet that definition. Why? Simply because, whilst modern financial accounting has its uses, it does not include all the costs of capital and hence all the costs of doing business. Therefore, the picture it paints is most likely to mislead management teams regarding both strategic and economic progress, as the above example demonstrates.
Until the appropriate authorities recognise the economic realities, we remain pessimistic regarding the longer-term feasibility of the beautiful game. Many commentators express a degree of suspicion and antipathy to investment coming from the Middle East and elsewhere. However, they fail to recognise the roots of the current situation which go back many years in that only those with both deep pockets and exceptional indulgence can, given the current economics of the game, afford to participate with any prospect of on-field success.
No one is denying the huge popularity of the English Premier League, but “marketing reach” is not the same as value creation. As ever, a quote from Warren Buffet comes to mind:
“Nothing sedates rationality like large doses of “effortless money.” After a heady experience of that kind, normally sensible people drift into behavior akin to that of Cinderella at the ball. They know that overstaying the festivities — that is, continuing to speculate in companies that have gigantic valuations relative to the cash they are likely to generate in the future — will eventually bring on pumpkins and mice. But they nevertheless hate to miss a single minute of what is one helluva party. Therefore, the giddy participants all plan to leave just seconds before midnight. There’s a problem, though: they are dancing in a room in which the clocks have no hands.”
We frequently hear that “the clubs might well be economically negative but look at the (ridiculous) valuations currently quoted across the media.” We say re-read the above Warren Buffet quote, then have a long think about one or two recent ‘valuations’ of clubs within the EPL, and then contemplate whether they are justified or not?
The Big Six
It is evident that financially the Big Six clubs continue to rule the roost although Newcastle United is starting to flex its financial muscle. Indeed, we are prepared to call at this time the distinctive split between those privateer clubs financed by wealthy individuals, the private equity-funded contingent and the state-owned clubs.
With the possibility that Manchester United may end up in the hands of a state-related entity from Qatar, the implications for the privateers are profound with increasing costs associated with a constantly rising labour market, transfer fees which is the price of remaining competitive. It is a squeeze from all sides. Yet, through good coaching and management the likes of Brentford and Brighton are still able to compete, but for how much longer?
Unfortunately, the vast majority of clubs outside of the Big 6 eventually succumb to what we call ‘economic exhaustion’ whereby the cost of remaining in the Premier League continually increases as do the economic losses which eventually reflects on the pitch with a decline in performance. Ultimately, the result is relegation and a battered balance sheet. Spending more gets you nowhere, so to speak.
But get this. We are sitting on 14 years of data. We can see that when the Big 6 clubs achieve bigger losses, their points tally decreases. When they reduce those losses, the points tally increases.
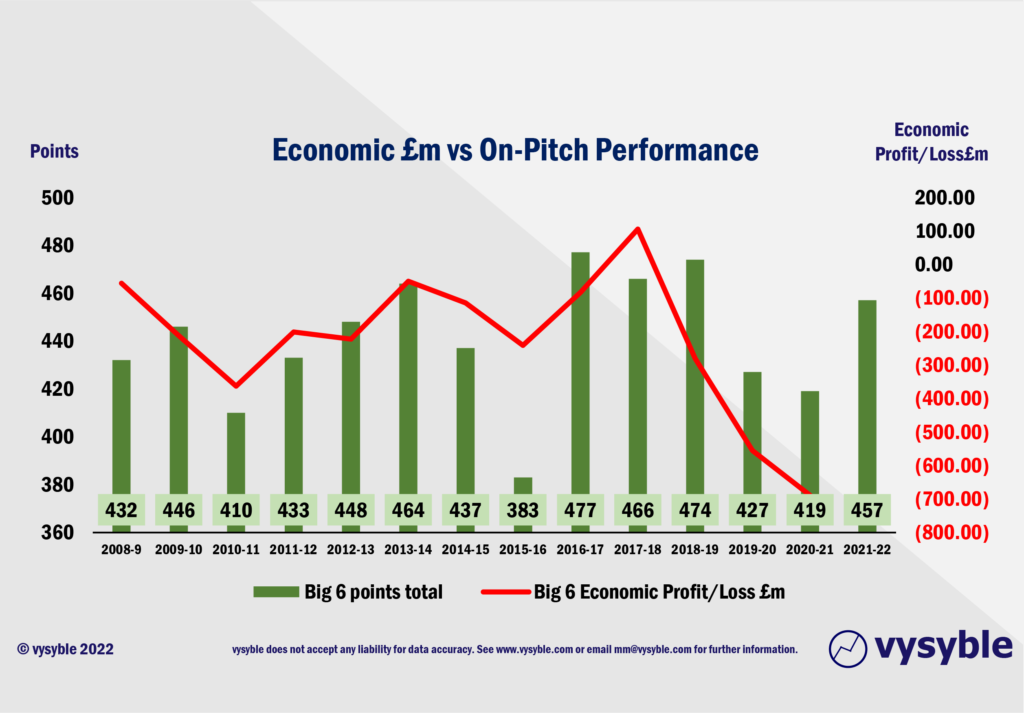
Who knew?
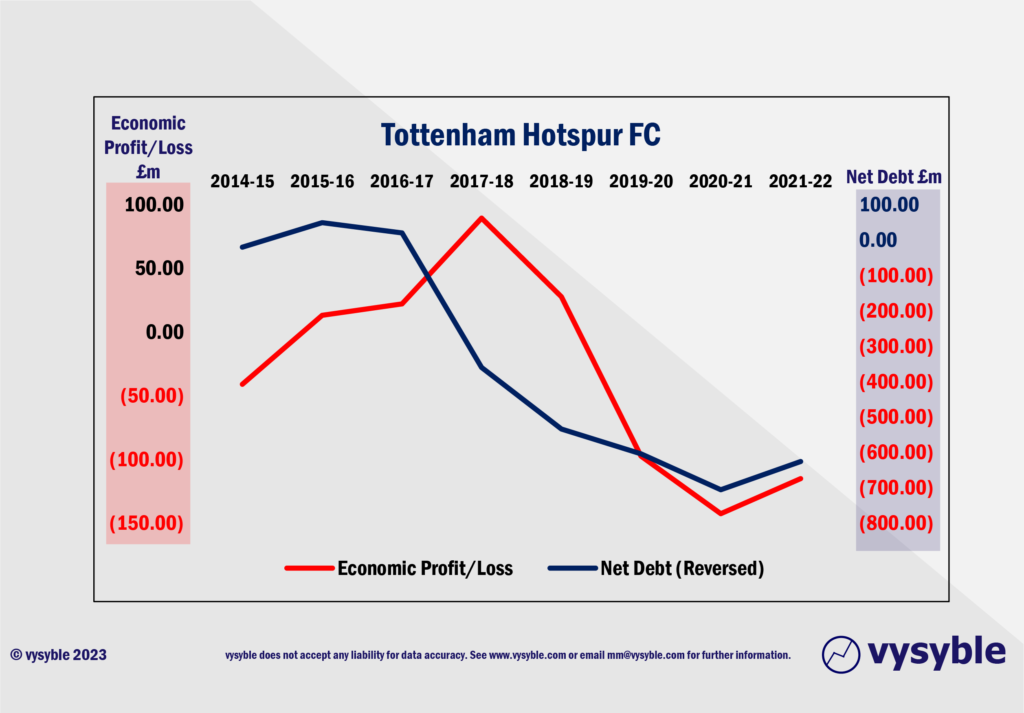
Indeed, the focus on revenue via money leagues and other promotional vehicles, belies a financial model that lacks resilience. Despite this, there are those who continue to extoll the virtues of revenue generation above all else. Tottenham Hotspur has been cited as one example, although when we dug into the numbers, we see costs outrunning revenue and the millstone of a very expensive shiny new stadium.
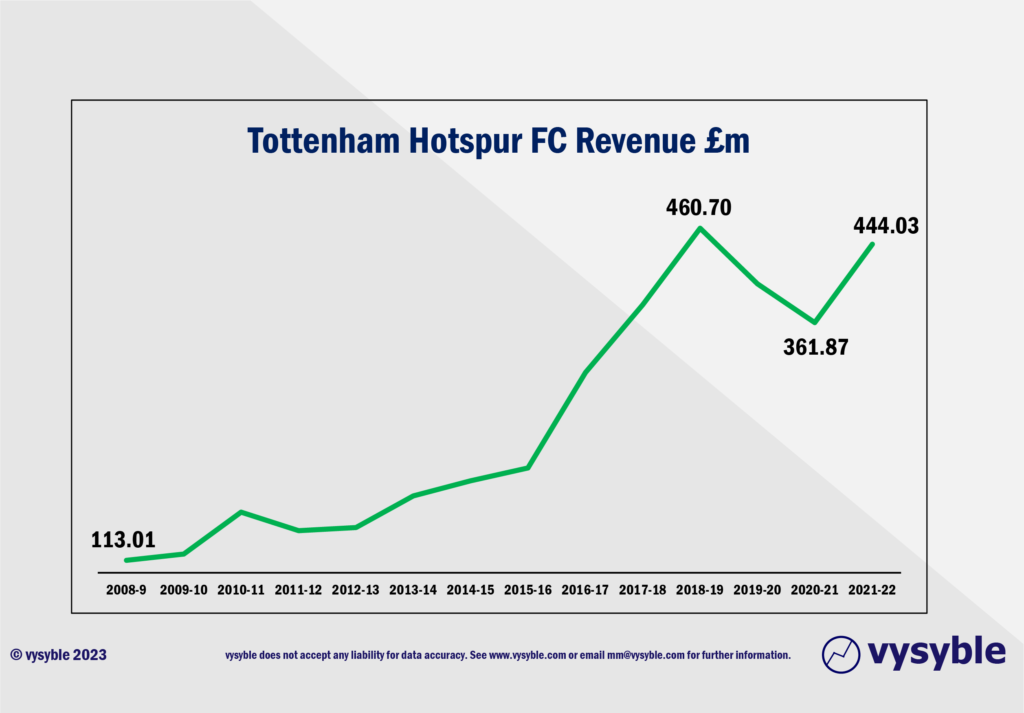
Since 2015-16, the club’s revenue has more than doubled.
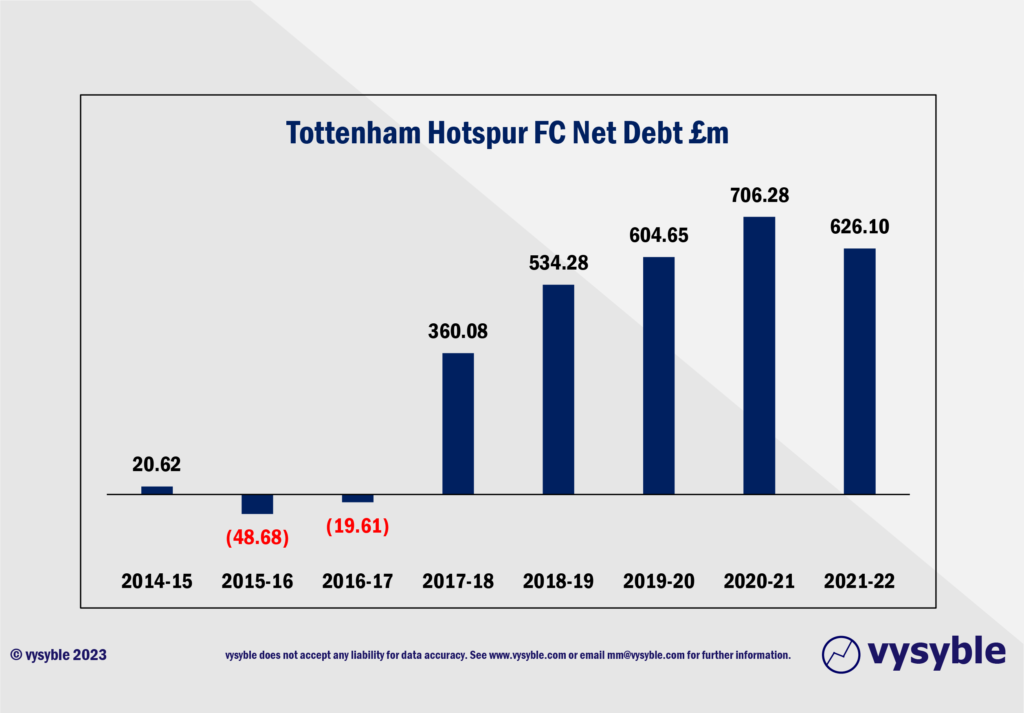
The lesson in this case is that for the lucky few in the mix to acquire Manchester United, the elephant in the room has to be the stadium reconstruction. Tottenham Hotspur’s stadium was originally costed at £400m. It ended up costing £1bn and the club is literally paying the price of the project’s inflated trajectory as can be seen via the net debt profile.
But the cost base has also risen with revenue – see below:
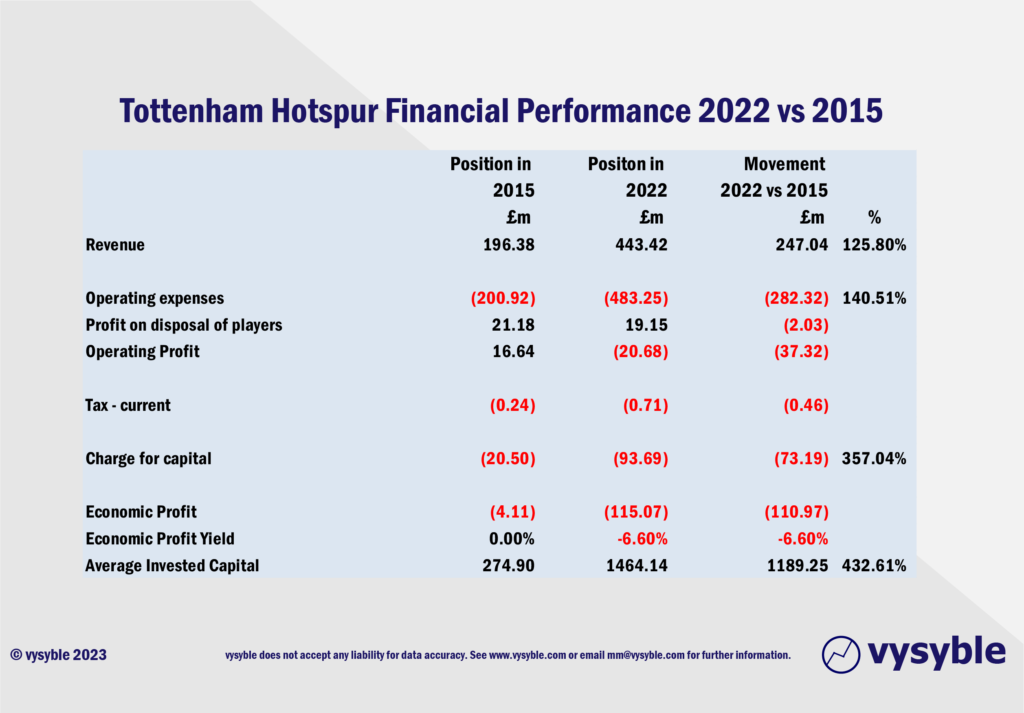
As net debt has increased, we also note that the economic performance of the club has declined…
We have seen media estimates regarding Old Trafford’s reconstruction costs between £1-1.5bn. Who is to say that it won’t be north of £2bn by the time the first footings are cemented in. As can be seen from the Tottenham Hotspur experience, the effect on the balance sheet can be profound and long-lasting.
Meanwhile, we await ten more balance sheets for the 2021-22 Premier League cohort. Having established the longer-term and more expensive effect of loan forgiveness, we wonder what the next financial rabbit will be when profits become even more elusive.
vysyble
Follow vysyble on Twitter
18th February 2023 – Blue Monday – Manchester City’s financial behaviour under the Premier League spotlight.
7th February 2023 – 25 Men Went to Mow – Chelsea’s US owners embark on talent spending spree.
24th November 2022 – Going Back Home – Not just Liverpool but Manchester United up for sale too.
9th November 2022 – The Leaving of Liverpool – Club owners appear to call it a day and mull sale of club.
30th September 2022 – Theatre of Breaking Dreams – Manchester United achieves its biggest annual economic loss.
4th August 2022 – Soccerball – Over-enthusiastic, over-subscribed and over here. The American invasion into English football is in full swing.
17th May 2022 – Money Heights – Valuation models fail to match the price paid to buy loss-making Chelsea.
25th April 2022 – Same but Different – UEFA’s proposed changes to Champions League qualification mirrors aspects of aborted Super League.
18th March 2022 – Let It Go – With a freeze on Russian assets, Chelsea hits the market following a record economic loss.
10th February 2022 – Underwater – Manchester United’s share price fails to defy gravity and sinks below its IPO level. Has the market got wise to the club’s poor economic performance?
1st December 2021 – Fantasy Football – The Fan-Led Review findings fall short of the necessary value-driven approach to regulatory reform.
23rd June 2021 – Road to Nowhere – Football stands at the crossroads ahead of the Fan-Led Review process. We examine the key questions that it must answer.
11th May 2021 – Prime Numbers – Football’s elite clubs seek a route to profit as fans yearn for sporting tradition. In between lies a gulf of mistrust and misapprehension.
26th April 2021 – A Bitter Pill – GSK’s new strategic direction fails to find riches in the middle of a pandemic when other pharma companies have prospered.
25th April 2021 – The Wrong Stuff – American-style football league won’t wash but the conditions that led to its launch are still present and are likely to get worse.
19th April 2021 – Super League Arrives – As we predicted, football’s elite breakaway emerges from the shadows.
30th March 2021 – $hooting B£ank$ – Arsenal’s commercial performance analysed.
22nd February 2021 – Measure for Measure – Take two financial measures, add pandemic and stir.
18th January 2021 – The Football Factory – If football was an industrial entity…
8th January 2021 – The Oil Majors – An Update – A shareholder return performance review of the 4 major oil companies in 2020.
10th December 2020 – Pump Up The Volume – ExxonMobil comes under fire from an agitated investor.
16th November 2020 – The Pain Game – Manchester United’s Q1 2021 financial release opens the lid on a Covid-19-affected financial can of worms.
11th November 2020 – A Tight Squeeze – Football’s Elephant in the Room leaving little space for financial relief.
29th October 2020 – Form and Function – Proposals-a-plenty for football’s structural reform.
13th October 2020 – Project Big Profit – Americans come bearing a proposal for football’s structural reform, just as we predicted in 2016.
8th October 2020 – Game Aid – Football is caught in the crossfire of indecision and financial necessity.
24th September 2020 – Crisis? What Crisis? – We look back 12 months at the demise of Thomas Cook and its relevance to more recent events.
11th September 2020 – Distance Learning – New rules and new values as Covid-19 challenges traditional mindsets and misconceptions.
19th August 2020 – Socked! Marks & Spencer’s Shrinking Value – Retail giant is fast becoming a shadow of its former self.
22nd May 2020 – You’re Gonna Need a Bigger Boat – An assessment of the double financial whammy of potential relegation from the Premier League and Covid-19.
30th April 2020 – Home, Alone – Initial indicators from the wider economy point towards economic and financial downsizing in sport.
6th April 2020 – Board Games – Government, football clubs and players adopt separate ‘brace’ positions as Covid-19 crashes the sports economy.
27th March 2020 – Markets, Mayhem and Manchester United – A look at the questions posed by the share prices of publicly listed businesses.
15th March 2020 – When Saturday Goes – Football has come to a halt. We take stock of the game’s position and ponder its return.
10th March 2020 – Futureworld – The potential economic effects of the COVID-19 outbreak.
19th February 2020 – Lemon Law – How Financial Fair Play can give a misleading view of football club finances.
8th February 2020 – Hammered – Our financial perspective on some of the clubs involved in the Premier League relegation battle.
12th December 2019 – The Cost of Chasing Gold– In collaboration with the BBC, we look at the high price being paid by clubs to gain promotion into the Premier League.
7th November 2019 – Where to Next for M&S? – November 2019 results suggests the retailer is losing its way
10th October 2019 – Red Mist – Manchester United’s 2019 FY numbers and the stagnation of England’s biggest revenue-earning club.
7th September 2019 – Not Just A Loss But… – A detailed look at the decline in Marks & Spencer’s fortunes.
29th August 2019 – Telling It Like It Is… – What really happened when we talked to the English Football League.
5th July 2019 – Chopping Board – Knives out for former Tesco chief.
25th May 2019 –Repeat Prescription – Few believed us the first time around regarding football’s financial plight…
19th March 2019 – Stuff and ‘Nonsense’– Why the Economic Profit metric is the most transparent measure of business performance.
13th March 2019 – Financial Fair Play – Guilty as Charged? – Our thoughts on FFP schemes and their key weakness.
18th December 2018 – Long Division – The Post-Ferguson years at Old Trafford have come at the expense of declining economic and on-pitch performance.
20th November 2018 – The Relegation Game – Tales of woe and economic performance at the wrong end of the Premier League table.
9th October 2018 – A Different View – Why fans ought to be acutely aware of football’s financial dynamics.
17th August 2018 – The End of the Beginning – La Liga heads west to conquer new worlds.
9th August 2018 – Reaching for Sky – the sequel – Latest offer price for satellite TV company is good for shareholders, less so for prospective owners.
8th August 2018 – American Dreams – English Premier League economic dynamics and American money – is a Euro Super League the next step?
3rd August 2018 – Mall Administration – Retail Property Co. bonus payouts at odds with increasing shareholder value.
20th April 2018 – Goonernomics Part Deux – The departure of Arsene Wenger…
18th April 2018 – The Price of Everything – Tesco’s latest numbers offer little in value.
12th April 2018 – Say What? – WPP’s very mixed message.
14th February 2018 – In Case of Emergency – Premier League’s UK TV rights auction comes up short.
7th February 2018 – Lost in Transmission – Top Premier League clubs look beyond domestic TV rights.
4th December 2017 – A Billion here, a Billion there… – The Premier League reaches a major milestone, quietly…
25th November 2017 – Getting out of Toon. – Is Mike Ashley pitching the sale price of Newcastle United at the right level?
16th October 2017 – Goonernomics. How the ‘Bank of England’ club falls short of its North London neighbour.
25th September 2017 – Highlights. More record-breaking numbers from the biggest football club in the land, but no economic profit…
23rd September 2017 – Football’s Economic Back Pass. A guest blog for the Soccernomics website.
12th September 2017 – Crystal Balls-up. Changing strategic direction is not a good idea when you haven’t looked at the economics.
27th July 2017 – Football’s Summer of Money and the £65 pint of beer. The sport that just can’t spend enough.
11th July 2017 – Football Special. Observations following the launch of ‘We’re So Rich…’
9th May 2017 – Illuminating, non? Political energy lacks vision and power.
2nd March 2017 – Claudio’s Burden. The price of failure outweighs the price of success.
12th January 2017 – Shopping for Godot. A never-ending quest for value in Retail.
27th December 2016 – Reaching for Sky. Is Rupert Murdoch’s £10.75 per share a fair price?
6th December 2016 – Auld Lang Syne. A reminder from history of the damage that poor financial planning can cause.
1st December 2016 – Fork Handles? Four Candles? Tesco’s blurred strategic vision.
27th November 2016 – Football’s Instant Replay. Financial warning signals for the top English Premier League clubs